
Salesforce CRM Analytics and Einstein Discovery Consultant Practice Exams
Last updated on Oct 22,2026- Exam Code: CRM Analytics and Einstein Discovery Consultant
- Exam Name: Salesforce Certified CRM Analytics and Einstein Discovery Consultant Exam
- Certification Provider: Salesforce
- Latest update: Oct 22,2026
At Universal Containers, a dashboard is built to track sales metrics. The Opportunity amount field has conditional formatting added ― it turns green for closed won and red for closed lost.
How should a CRM Analytics consultant enhance the dashboard design to become more accessible to users with color vision challenges?
- A . Position Alt Texts next to the KPIs to make it more understandable.
- B . Add up and down arrow next to the KPIs to make it more understandable.
- C . Make the numbers bold to emphasize whether it is won or lost.
B
Explanation:
Enhancing accessibility, especially for users with color vision challenges, is critical. Adding up and down arrows next to the KPIs:
Visual Cues: Provides a non-color dependent method to indicate whether metrics are positive (up arrow) or negative (down arrow).
Accessibility: Improves understanding for users with color vision deficiencies, ensuring that the dashboard is inclusive.
User Experience: Enhances the overall usability of the dashboard by making the interpretation of data straightforward and less reliant on color.
A consultant is building a CRM Analytics dashboard for Universal Containers. The consultant has enabled data sync to increase the speed of datasets refreshing.
How often will the data on the dashboard be refreshed?
- A . When dataflow/recipe runs to completion, and then data syne runs to completion
- B . When the dashboard viewer clicks the Refresh button
- C . When data sync runs to completion, and then dataflow/recipe runs to completion
An CRM Analytics consultant creates a model to maximize the satisfaction of cases. They want to deploy the mode! and further use the model and predictions in an existing automated business process
powered by Salesforce Flow.
What is the most efficient way to accomplish this?
- A . Create a trigger on Case object and use REST APIs to append the predictions into the business process.
- B . Use the Einstein Discovery flow action to make a prediction with the flow.
- C . Write an Apex class with Einstein Discovery Predictions and append them to process.
A CRM Analytics consultant has been asked to refactor a dashboard so that it loads quicker. After some analysis, the consultant found that most of the dashboard queries run in less than 5 seconds; however, the Opportunities Table takes more time to load when scrolled down from its initial view.
How should the consultant improve the performance of this dashboard?
- A . Create a second page on the dashboard and move the table to this new page.
- B . Create a second dashboard and move the table to this new dashboard.
- C . Create a Visualforce page and display a list view of the Opportunities on this new page.
A
Explanation:
In CRM Analytics, performance issues often arise when large tables or datasets are loaded on a single dashboard page, especially when the table contains a lot of data, as in the case of the Opportunities Table. One way to improve performance is to split the dashboard into multiple pages, moving resource-intensive components (like large tables) to a secondary page. By creating a second page and relocating the Opportunities Table, the initial dashboard page will load faster, and users can still access the table by navigating to the second page when needed. This practice ensures better overall performance and user experience.
Reference: CRM Analytics Dashboard Optimization
A consultant creates a CRM Analytics dashboard in a sandbox and it needs to be migrated into production.
What should the consultant use to complete the migration?
- A . Analytics dashboard connector
- B . Change sets
- C . Analytics External Data API
Universal Containers has a single dataset that contains the attainment and commission fields for all sales reps. Each sales rep should be able view the attainment data for each rep in their division. Each rep should only be able to see their own commission data.
Which option should a CRM Analytics consultant use to enforce this requirement?
- A . Utilize a single dataset and apply security predicates and/or sharing inheritance.
- B . Create separate datasets for attainment and commission, and apply security Predicates and/or sharing inheritance.
- C . Add the sales organization to the attainment dataset access list to be able to view commission data.
A CRM Analytics consultant is reviewing results from an Einstein Discovery story with a business user. They agree with the findings but notice that none of the fields used in the story have a correlation value greater than 4%. The client is now concerned that the model may not be good enough to deploy.
Which action should the consultant take?
- A . A Identify additional data that may have a stronger relationship with the outcome variable.
- B . Edit the model accuracy settings and rerun it to evaluate the correlation.
- C . Use the appropriate algorithm and update the model.
A company wants to create a timeline chart to visualize the evolution of its Closed Won opportunities.
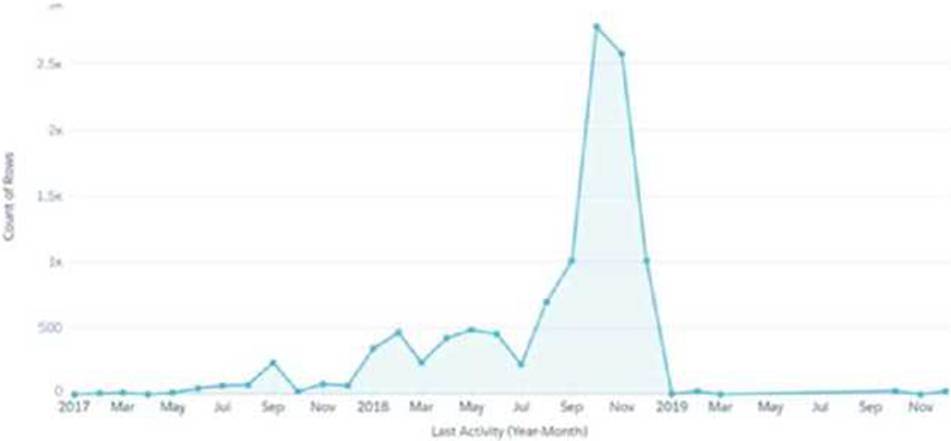
What are the required parameters to build a lens that displays output similar to the image shown?
- A . 1 measure, 0 groupings if trellis Is disabled, or 0-2 groupings If trellis is enabled
- B . 1 measure, 1-2 groupings if trellis is disabled, or 1-4 groupings if trellis is enabled
- C . 1 measure, 1 grouping by a date field, and either 0-1 groupings groupings by a dimension if trellis is disabled, or 0-2 groupings if trellis is enabled
C
Explanation:
To create a timeline chart similar to the one shown, the following parameters are typically required: 1 Measure: This could be the count of Closed Won opportunities or any other relevant metric that needs to be tracked over time.
1 Grouping by a Date Field: This is essential to plot the timeline effectively. The date field would typically be the close date of the opportunities.
Additional Groupings: Depending on the complexity and the detail needed, additional groupings can be added. For example, grouping by region or product line can provide more insights into the timeline. If trellis is used, it allows for the creation of multiple smaller charts within the main chart, each representing a slice of data based on the additional groupings.
This setup helps visualize the evolution of Closed Won opportunities over time, making it easy to spot trends, seasonal patterns, or other relevant insights.
Universal Containers (UC) recently activated data sync in the CRM Analytics data manager. After running the sync, UC notices that the aggregate sum of a field within the company’s dataset is different than what they manually calculated by summing the same data in the Salesforce object.
What is causing the issue with the newly synced data?
- A . Differences involving flow-updated fields
- B . Differences involving formula fields
- C . Differences involving trigger-updated fields
A CRM Analytics consultant is updating an existing recipe.
They are looking to add a few additional fields onto the Account dataset. One of the fields to be added is a multi-select picklist field that needs to be shown as text on the dashboard.
What should the consultant do to accomplish this?
- A . Use the array_join multivalue runcuen co convert this field to a text prior to registering the dataset.
- B . Use the array multivalue function to convert this field to a text prior to registering the dataset.
- C . Use the string multivalue function to convert this field to a text prior to registering the dataset.