
Microsoft DP-600 Practice Exams
Last updated on Oct 01,2026- Exam Code: DP-600
- Exam Name: Implementing Analytics Solutions Using Microsoft Fabric
- Certification Provider: Microsoft
- Latest update: Oct 01,2026
DRAG DROP
You are implementing two dimension tables named Customers and Products in a Fabric warehouse.
You need to use slowly changing dimension (SCD) to manage the versioning of data.
The solution must meet the requirements shown in the following table.

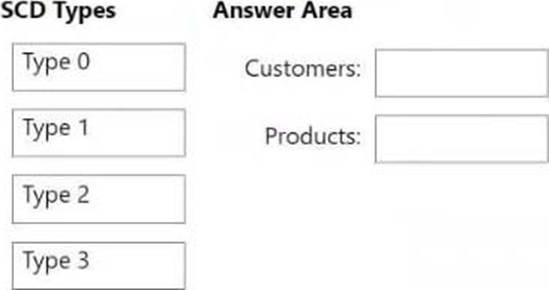
Which type of SCD should you use for each table? To answer, drag the appropriate SCD types to the correct tables. Each SCD type may be used once, more than once, or not at all. You may need to drag the split bar between panes or scroll to view content. NOTE: Each correct selection is worth one point.
Explanation:
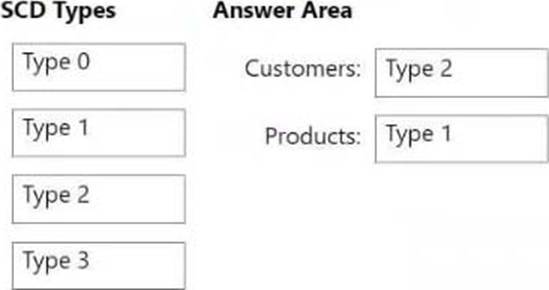
Box 1: Type 2
There are 6 types of Slowly Changing Dimension that are commonly used, they are as follows:
Type 0 C Fixed Dimension
No changes allowed, dimension never changes
Type 1 C No History
Update record directly, there is no record of historical values, only current state
Type 2 C Row Versioning
Track changes as version records with current flag & active dates and other metadata
Type 3 C Previous Value column
Track change to a specific attribute, add a column to show the previous value, which is updated as further changes occur
Etc.
Box 2: Type 1
Reference: https://adatis.co.uk/introduction-to-slowly-changing-dimensions-scd-types/
You have a Fabric tenant that contains a semantic model. The model uses Direct Lake mode.
You suspect that some DAX queries load unnecessary columns into memory.
You need to identify the frequently used columns that are loaded into memory.
What are two ways to achieve the goal? Each correct answer presents a complete solution. NOTE: Each correct answer is worth one point.
- A . Use the Analyze in Excel feature.
- B . Use the Vertipaq Analyzer tool.
- C . Query the $System.DISCOVER_STORAGE_TABLE_COLUMN_SEGMENTS dynamic management view (DMV).
- D . Query the DISCOVER_MEMORYGRANT dynamic management view (DMV).
HOTSPOT
You have a Fabric tenant that contains a workspace named Workspace_DEV. Workspace_DEV contains the semantic models shown in the following table.
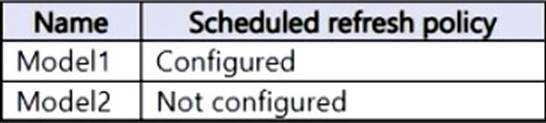
Workspace_DEV contains the dataflows shown in the following table.

You create a new workspace named Workspace_TEST.
You create a deployment pipeline named Pipeline1 to move items from Workspace_DEV to Workspace_TEST.
You run Pipeline1.
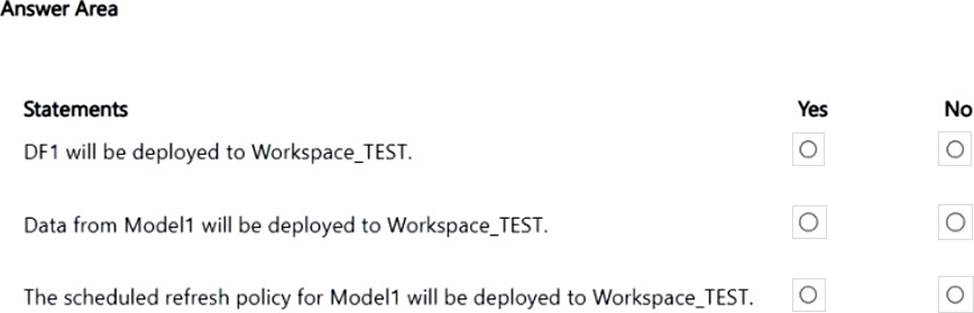
For each of the following statements, select Yes if the statement is true. Otherwise, select No. NOTE: Each correct selection is worth one point.
Explanation:
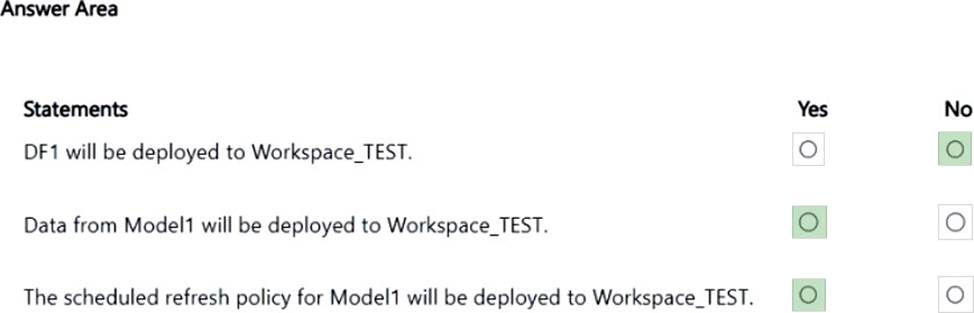
Box 1: No
No – DF1 will be deployed to Workspace_TEST.
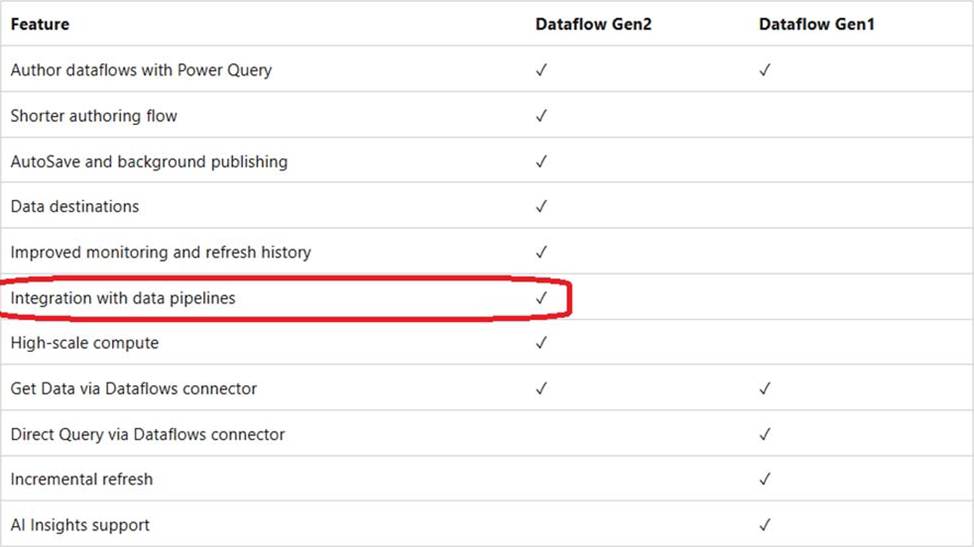
DF1 is a Dataflow Gen1 and is configured with a scheduled refresh policy.
Gen1 dataflows cannot be integrated into data pipelines.
Note: Microsoft Fabric Data Factory, Getting from Dataflow Generation 1 to Dataflow Generation 2
Dataflow Gen2 is the new generation of dataflows. The new generation of dataflows resides alongside the Power BI Dataflow (Gen1) and brings new features and improved experiences. The following section provides a comparison between Dataflow Gen1 and Dataflow Gen2.
Box 2: Yes
Yes – Data from Model1 will be deployed to Workspace_TEST.
Assign a workspace to an empty stage
When you assign content to an empty stage, a new workspace is created on a capacity for the stage you deploy to. All the metadata in the reports, dashboards, and semantic models of the original workspace is copied to the new workspace in the stage you’re deploying to.
After the deployment is complete, refresh the semantic models so that you can use the newly copied content. The semantic model refresh is required because data isn’t copied from one stage to another.
Box 3: Yes
Yes – The scheduled refresh policy for Model1 will be deployed to Workspace_TEST:
Reference: https://learn.microsoft.com/en-us/fabric/data-factory/dataflows-gen2-overview
You have a Fabric warehouse that contains a table named SalesOrderDetail, SalesOrderDetail contains three columns named OrderQty, ProductID and SalesOrderlD. SalesOrderDetail contains one row per combination of SalesOrderlD and ProductID.
You need to calculate the proportion of the total quantity of each sales order represented by each product within the sales order.
Which T-SQL statement should you run?
A)

B)

C)

D)

- A . Option A
- B . Option B
- C . Option C
- D . Option D
D
Explanation:
The goal is to calculate the proportion of the total quantity for each sales order (SalesOrderID)
represented by each product (ProductID) within that sales order.
To achieve this, you need to:
You have a Fabric warehouse that contains a table named SalesOrderDetail, SalesOrderDetail contains three columns named OrderQty, ProductID and SalesOrderlD. SalesOrderDetail contains one row per combination of SalesOrderlD and ProductID.
You need to calculate the proportion of the total quantity of each sales order represented by each product within the sales order.
Which T-SQL statement should you run?
A)
B)
C)
D)
- A . Option A
- B . Option B
- C . Option C
- D . Option D
D
Explanation:
The goal is to calculate the proportion of the total quantity for each sales order (SalesOrderID)
represented by each product (ProductID) within that sales order.
To achieve this, you need to:
Note: This question is part of a series of questions that present the same scenario. Each question in the series contains a unique solution that might meet the stated goals. Some question sets might have more than one correct solution, while others might not have a correct solution.
After you answer a question in this section, you will NOT be able to return to it. As a result, these questions will not appear in the review screen.
You have a Fabric tenant that contains a new semantic model in OneLake.
You use a Fabric notebook to read the data into a Spark DataFrame.
You need to evaluate the data to calculate the min, max, mean, and standard deviation values for all the string and numeric columns.
Solution: You use the following PySpark expression:
df.explain().show()
Does this meet the goal?
- A . Yes
- B . No
B
Explanation:
Correct Solution: You use the following PySpark expression:
df.summary()
summary(*statistics)[source]
Computes specified statistics for numeric and string columns. Available statistics are: – count – mean – stddev – min – max – arbitrary approximate percentiles specified as a percentage (eg, 75%)
If no statistics are given, this function computes count, mean, stddev, min, approximate quartiles (percentiles at 25%, 50%, and 75%), and max.
Note This function is meant for exploratory data analysis, as we make no guarantee about the backward compatibility of the schema of the resulting DataFrame.
>>> df.summary().show() +——-+——————+—–+
| stddev|2.1213203435596424| null|
Incorrect:
* df.show()
* df.explain().show()
* df.explain()
explain(extended=False)[source]
Prints the (logical and physical) plans to the console for debugging purpose.
Parameters: extended C boolean, default False. If False, prints only the physical plan.
>>> df.explain()
== Physical Plan ==
Scan ExistingRDD[age#0,name#1]
>>> df.explain(True)
== Parsed Logical Plan ==
…
== Analyzed Logical Plan ==
…
== Optimized Logical Plan ==
…
== Physical Plan ==
Reference: https://spark.apache.org/docs/2.3.0/api/python/pyspark.sql.html
HOTSPOT
You have a Microsoft Power BI semantic model.
You plan to implement calculation groups.
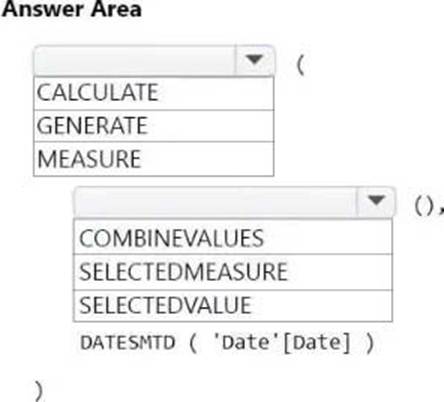
You need to create a calculation item that will change the context from the selected date to month-to-date (MTD).
How should you complete the DAX expression? To answer, select the appropriate options in the answer area. NOTE: Each correct selection is worth one point.
Explanation:
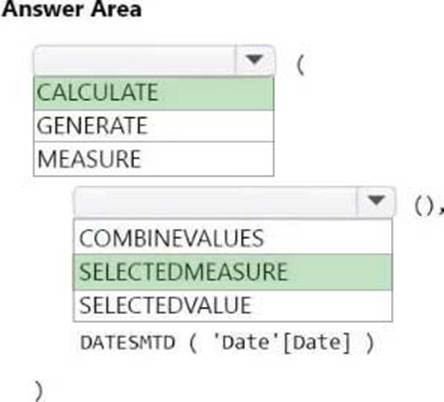
Box 1: CALCULATE
The following calculation item expression calculates the year-to-date for whatever the measure is in context.
CALCULATE(SELECTEDMEASURE(), DATESYTD(DimDate[Date]))
Note: CALCULATE
Evaluates an expression in a modified filter context.
Syntax
DAX
CALCULATE(<expression>[, <filter1> [, <filter2> [, …]]])
Box 2: SELECTEDMEASURE
Incorrect:
* GENERATE
Returns a table with the Cartesian product between each row in table1 and the table that results from evaluating table2 in the context of the current row from table1.
Syntax
GENERATE(<table1>, <table2>)
* MEASURE
Introduces a measure definition in a DEFINE statement of a DAX query.
Syntax
[DEFINE
(
MEASURE <table name>[<measure name>] = <scalar expression>)+
]
(EVALUATE <table expression>) +
Parameters
* SELECTEDVALUE
Returns the value when the context for columnName has been filtered down to one distinct value only.
Otherwise returns alternateResult.
Syntax
SELECTEDVALUE(<columnName>[, <alternateResult>])
Note: DATESMTD
Returns a table that contains a column of the dates for the month to date, in the current context.
Syntax
DATESMTD(<dates>)
Reference: https://learn.microsoft.com/en-us/dax/selectedmeasure-function-dax
DRAG DROP
You have a Fabric tenant that contains a semantic model. The model contains data about retail stores.
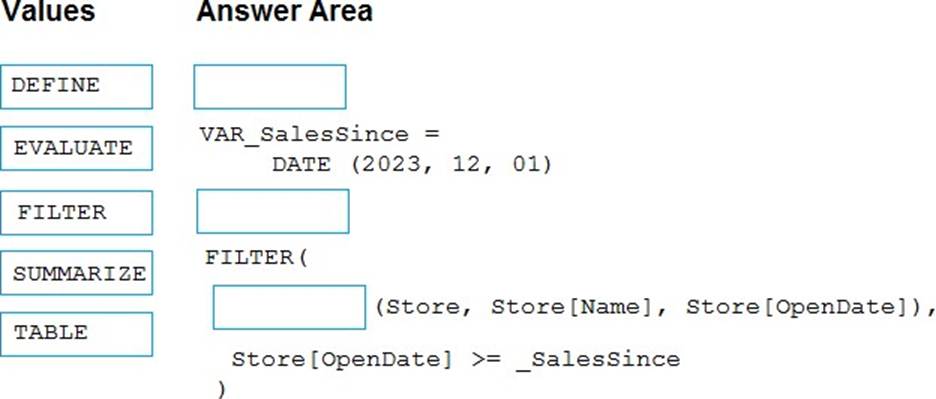
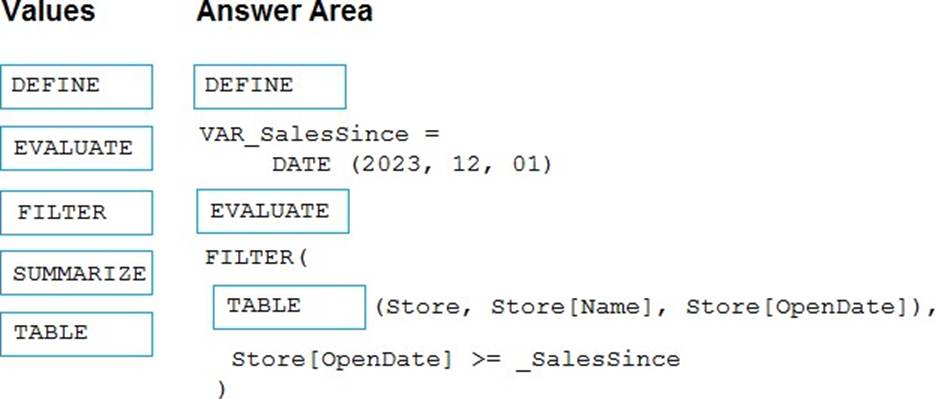
You need to write a DAX query that will be executed by using the XMLA endpoint. The query must return a table of stores that have opened since December 1, 2023.
How should you complete the DAX expression? To answer, drag the appropriate values to the correct targets. Each value may be used once, more than once, or not at all. You may need to drag the split bar between panes or scroll to view content. NOTE: Each correct selection is worth one point.
Select and Place:
Explanation:
Box 1: DEFINE
DEFINE
Introduces a statement with one or more entity definitions that can be applied to one or more EVALUATE statements of a DAX query.
Syntax
[DEFINE
(
(MEASURE <table name>[<measure name>] = <scalar expression>) | (VAR <var name> = <table or scalar expression>) | (TABLE <table name> = <table expression>) |
(COLUMN <table name>[<column name>] = <scalar expression>) |)+
]
(EVALUATE <table expression>) +
Box 2: EVALUATE
EVALUATE
Introduces a statement containing a table expression required in a DAX query.
Syntax
EVALUATE <table>
Box 3: TABLE
Table constructor
Returns a table of one or more columns.
Syntax
{ <scalarExpr1>, <scalarExpr2>, … }
{ (<scalarExpr1>, <scalarExpr2>, … ), (<scalarExpr1>, <scalarExpr2>, … ), … }
Note: FILTER
Returns a table that represents a subset of another table or expression.
Syntax
FILTER(<table>, <filter>)
Reference:
https://learn.microsoft.com/en-us/dax/define-statement-dax
https://learn.microsoft.com/en-us/dax/evaluate-statement-dax
https://learn.microsoft.com/en-us/dax/table-constructor
You have a Fabric tenant that contains a data pipeline.
You need to ensure that the pipeline runs every four hours on Mondays and Fridays.
To what should you set Repeat for the schedule?
- A . Daily
- B . By the minute
- C . Weekly
- D . Hourly
HOTSPOT
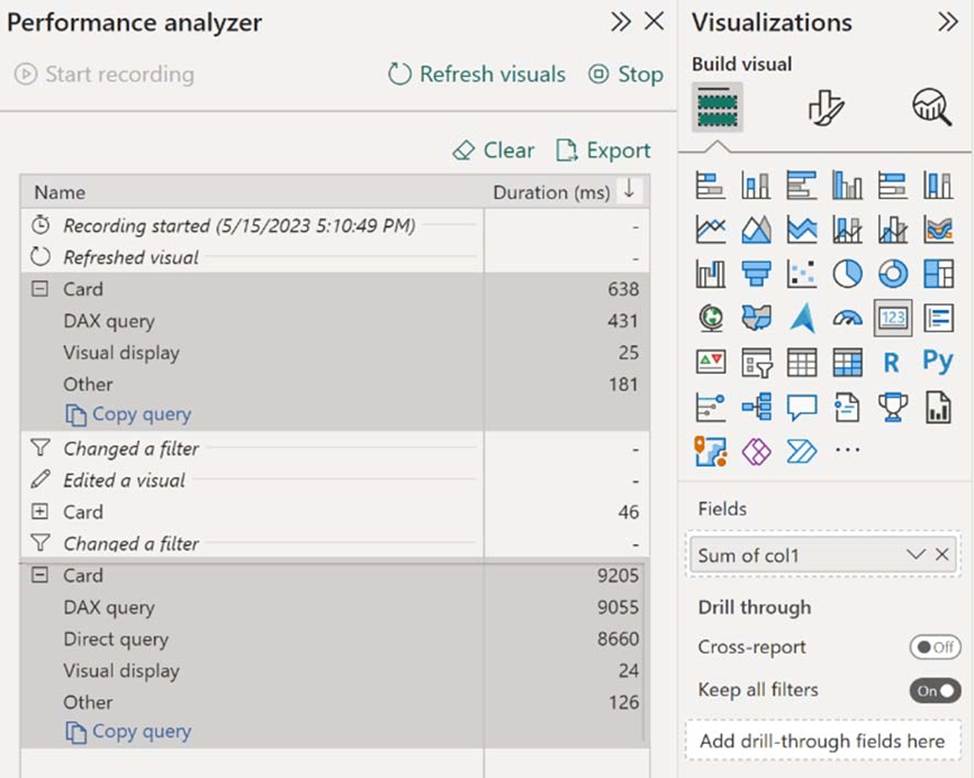
You have a Microsoft Power BI report and a semantic model that uses Direct Lake mode.
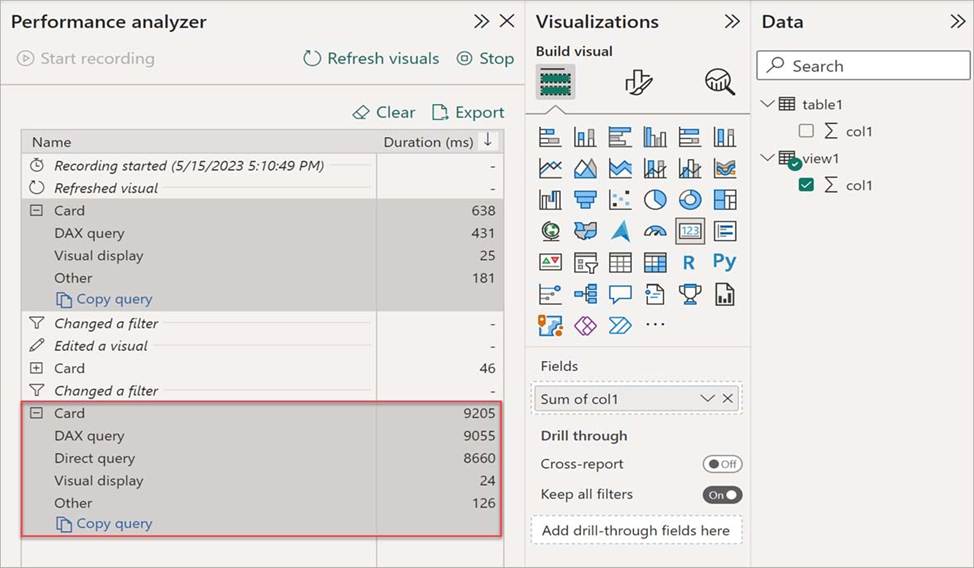
From Power BI Desktop, you open Performance analyzer as shown in the following exhibit.
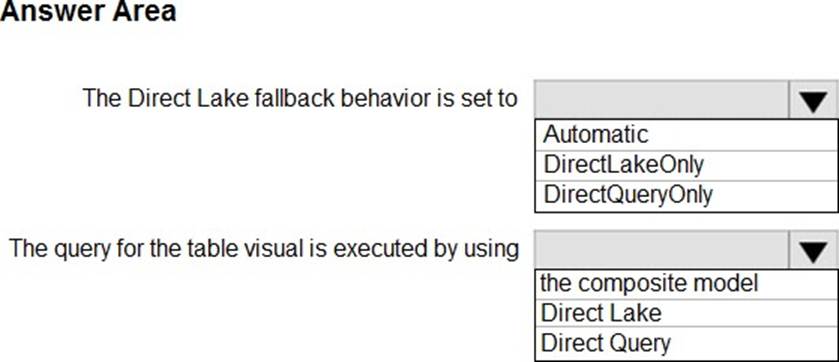
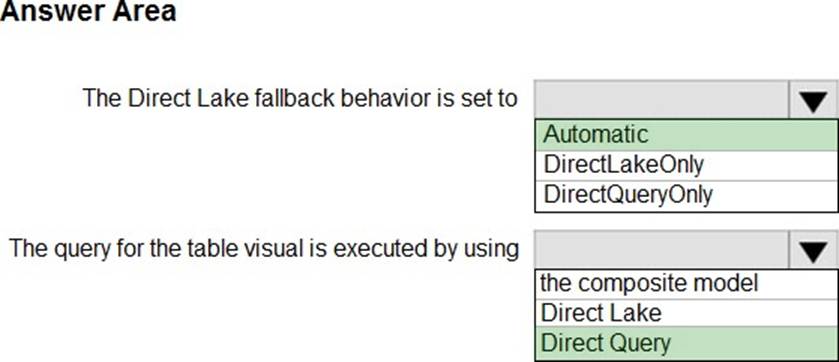
Use the drop-down menus to select the answer choice that completes each statement based on the information presented in the graphic. NOTE: Each correct selection is worth one point.
Explanation:
Box 1: Automatic
The Direct Lake fallback behavior is set to
Power BI datasets in Direct Lake mode read delta tables directly from OneLake ― unless they have to fall back to DirectQuery mode. Typical fallback reasons include memory pressures that can prevent loading of columns required to process a DAX query, and certain features at the data source might not support Direct Lake mode, like SQL views in a Warehouse. In general, Direct Lake mode provides the best DAX query performance unless a fallback to DirectQuery mode is necessary. Because fallback to DirectQuery mode can impact DAX query performance, it’s important to analyze query processing for a Direct Lake dataset to identify if and how often fallbacks occur.
Note: Fallback behavior
Direct Lake models include the DirectLakeBehavior property, which has three options:
Automatic – (Default) Specifies queries fall back to DirectQuery mode if data can’t be efficiently loaded into memory.
DirectLakeOnly – Specifies all queries use Direct Lake mode only. Fallback to DirectQuery mode is disabled. If data can’t be loaded into memory, an error is returned. Use this setting to determine if DAX queries fail to load data into memory, forcing an error to be returned.
DirectQueryOnly – Specifies all queries use DirectQuery mode only. Use this setting to test fallback performance.
Box 2: Direct Query
In the Performance analyzer pane, select Refresh visuals, and then expand the Card visual. The card visual doesn’t cause any DirectQuery processing, which indicates the dataset was able to process the visual’s DAX queries in Direct Lake mode.
If the dataset falls back to DirectQuery mode to process the visual’s DAX query, you see a Direct query performance metric, as shown in the following image:
Reference:
https://learn.microsoft.com/en-us/power-bi/enterprise/directlake-analyze-qp
https://learn.microsoft.com/en-us/power-bi/enterprise/directlake-overview