
Microsoft DP-600 Practice Exams
Last updated on Oct 01,2026- Exam Code: DP-600
- Exam Name: Implementing Analytics Solutions Using Microsoft Fabric
- Certification Provider: Microsoft
- Latest update: Oct 01,2026
HOTSPOT
You have a Fabric tenant that contains a PySpark notebook named Notebook1.
You define sas_token as a variable in the first cell of Notebook1 and store a shared access signature (SAS) token in the variable.
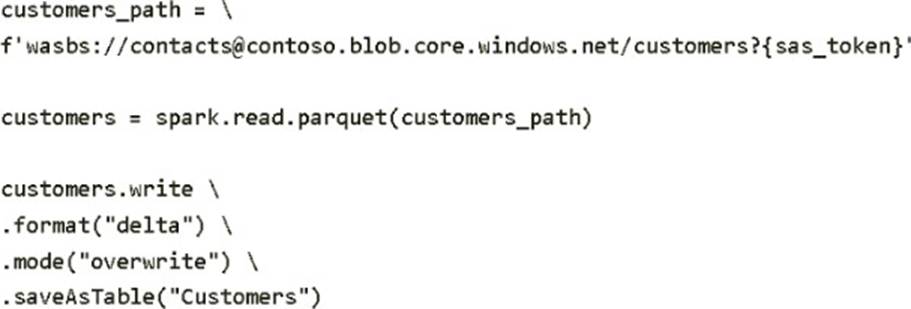
In the second cell, you run the following code.
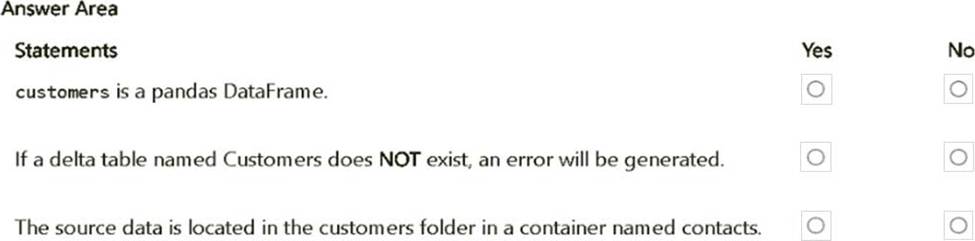
For each of the following statements, select Yes if the statement is true. Otherwise, select No. NOTE: Each correct selection is worth one point. Hot Area:
Explanation:
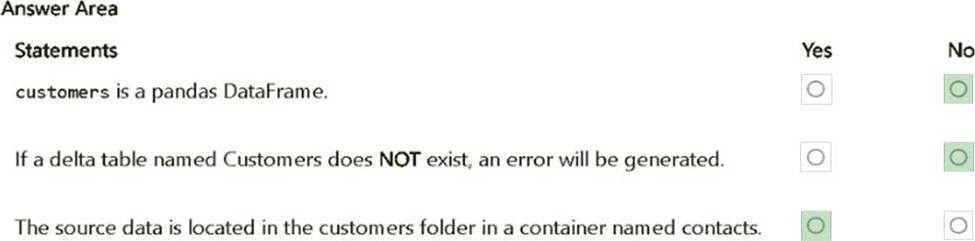
customers is a pandas DataFrame. – No.
The customers DataFrame is created using spark.read.parquet(), which is part of PySpark.
Therefore, customers is a Spark DataFrame, not a pandas DataFrame.
If a delta table named Customers does NOT exist, an error will be generated. – No.
The code uses .mode("overwrite"), which will create the table if it does not exist. There will not be an error if the table does not exist initially.
The source data is located in the customers folder in a container named contacts. – Yes.
The URI wasbs://[email protected]/customers specifies that the data is stored in a container named contacts within the folder customers.
DRAG DROP
You have a Fabric tenant that contains a Microsoft Power BI report named Report1.
Report1 is slow to render. You suspect that an inefficient DAX query is being executed.
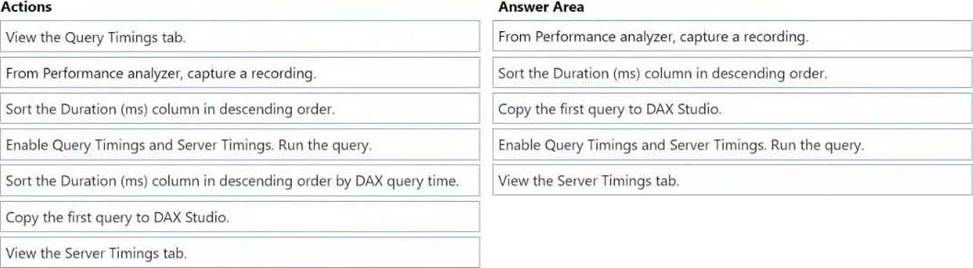
You need to identify the slowest DAX query, and then review how long the query spends in the formula engine as compared to the storage engine.
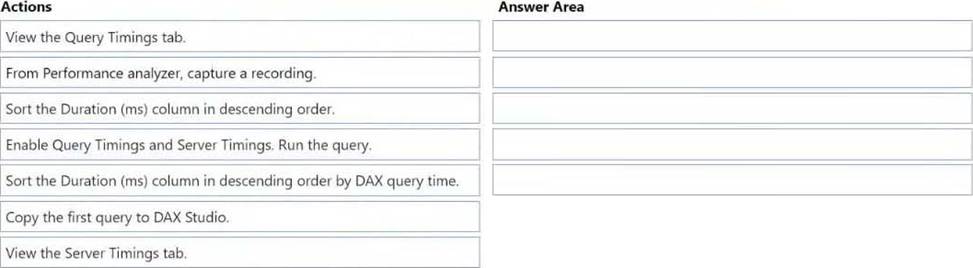
Which five actions should you perform in sequence? To answer, move the appropriate actions from the list of actions to the answer area and arrange them in the correct order.
Explanation:
Step 1: From Performance analyzer, capture a recording Performance Analyzer to increase performance The performance analyzer is a tool, built in to Power BI, that can help you to find different aspects that make your report to run slowly.
How do you get the results from Performance Analyzer?
To get the result above from the performance analyzer, use the steps below:
You have a Fabric tenant that contains two workspaces named Workspace1 and Workspace2. Workspace1 contains a lakehouse named Lakehouse1. Workspace2 contains a lakehouse named Lakehouse2. Lakehouse1 contains a table named dbo.Sales. Lakehouse2 contains a table named dbo.Customers.
You need to ensure that you can write queries that reference both dbo.Sales and dbo.Customers in the same SQL query without making additional copies of the tables.
What should you use?
- A . a shortcut
- B . a dataflow
- C . a view
- D . a managed table
You have a Fabric tenant.
You plan to create a data pipeline named Pipeline1. Pipeline1 will include two activities that will execute in sequence.
You need to ensure that a failure of the first activity will NOT block the second activity.
Which conditional path should you configure between the first activity and the second activity?
- A . Upon Failure
- B . Upon Completion
- C . Upon Skip
- D . Upon Success
B
Explanation:
Conditional paths
Azure Data Factory and Synapse Pipeline orchestration allows conditional logic and enables the user to take a different path based upon outcomes of a previous activity. Using different paths allow users to build robust pipelines and incorporates error handling in ETL/ELT logic. In total, we allow four conditional paths.
* Upon Success
(Default Pass) Execute this path if the current activity succeeded
* Upon Failure
Execute this path if the current activity failed
*-> Upon Completion
Execute this path after the current activity completed, regardless if it succeeded or not
* Upon Skip
Execute this path if the activity itself didn’t run
You may add multiple branches following an activity, with one exception: Upon Completion path can’t coexist with either Upon Success or Upon Failure path. For each pipeline run, at most one path is activated, based on the execution outcome of the activity.
Reference: https://learn.microsoft.com/en-us/azure/data-factory/tutorial-pipeline-failure-error-handling
You have a Fabric tenant.
You plan to create a data pipeline named Pipeline1. Pipeline1 will include two activities that will execute in sequence.
You need to ensure that a failure of the first activity will NOT block the second activity.
Which conditional path should you configure between the first activity and the second activity?
- A . Upon Failure
- B . Upon Completion
- C . Upon Skip
- D . Upon Success
B
Explanation:
Conditional paths
Azure Data Factory and Synapse Pipeline orchestration allows conditional logic and enables the user to take a different path based upon outcomes of a previous activity. Using different paths allow users to build robust pipelines and incorporates error handling in ETL/ELT logic. In total, we allow four conditional paths.
* Upon Success
(Default Pass) Execute this path if the current activity succeeded
* Upon Failure
Execute this path if the current activity failed
*-> Upon Completion
Execute this path after the current activity completed, regardless if it succeeded or not
* Upon Skip
Execute this path if the activity itself didn’t run
You may add multiple branches following an activity, with one exception: Upon Completion path can’t coexist with either Upon Success or Upon Failure path. For each pipeline run, at most one path is activated, based on the execution outcome of the activity.
Reference: https://learn.microsoft.com/en-us/azure/data-factory/tutorial-pipeline-failure-error-handling
You have a Microsoft Power BI semantic model that contains a measure named TotalSalesAmount.
TotalSalesAmount returns a sales revenue amount that is translated into a selected currency.
You need to ensure that the value returned by TotalSalesAmount is formatted to use the correct currency symbol.
What should you include in the solution?
- A . a field parameter
- B . a linguistic schema
- C . a dynamic format string
- D . the WINDOW DAX function
C
Explanation:
Power BI, Create dynamic format strings for measures
With dynamic format strings for measures, you can determine how measures appear in visuals by conditionally applying a format string with a separate DAX expression.
A common scenario with financial reports is showing the currency converted to other country currencies by multiplying the base currency by an exchange rate. This also takes advantage of the dynamic format strings of calculation items to show the converted currency also in the correct currency format. Calculation items can have the conversion DAX expression defined once that can be applied to the many measures in the model showing currency values, without the need to edit or duplicate many measures.
Reference:
https://learn.microsoft.com/en-us/power-bi/create-reports/desktop-dynamic-format-strings
https://powerbi.microsoft.com/en-us/blog/deep-dive-into-the-model-explorer-with-calculation-group-authoring-and-creating-relationships-in-the-properties-pane/
You have a Fabric tenant that contains a warehouse.
Several times a day, the performance of all warehouse queries degrades. You suspect that Fabric is throttling the compute used by the warehouse.
What should you use to identify whether throttling is occurring?
- A . the Capacity settings
- B . the Monitoring hub
- C . dynamic management views (DMVs)
- D . the Microsoft Fabric Capacity Metrics app
D
Explanation:
Monitor overload information with Fabric Capacity Metrics App
Capacity administrators can view overload information and drilldown further via Microsoft Fabric Capacity Metrics app.
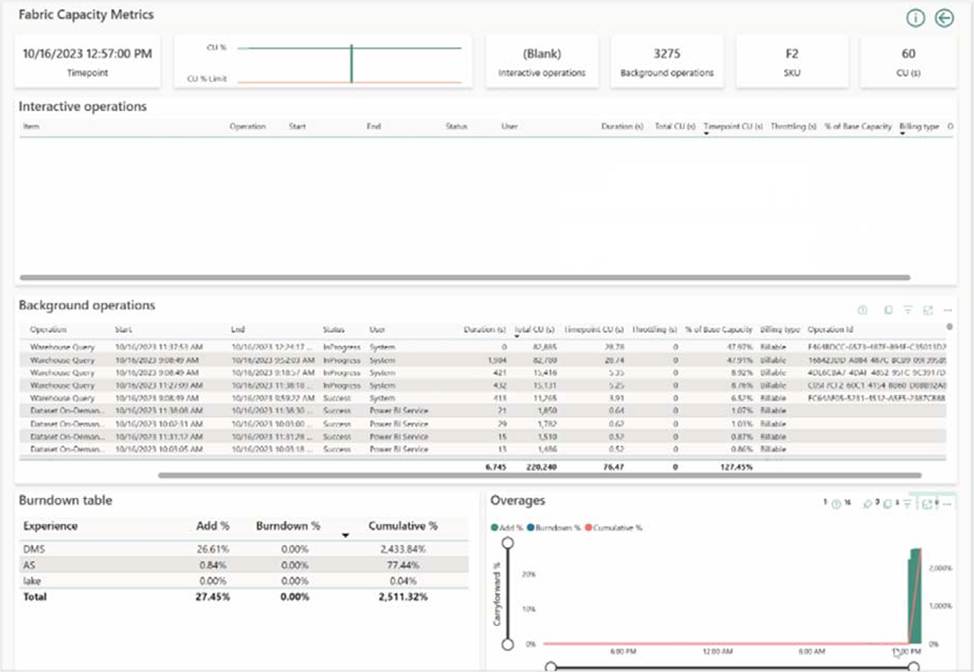
Note: Throttling
Throttling occurs when a customer’s capacity consumes more CPU resources than what was purchased. After consumption is smoothed, capacity throttling policies will be checked based on the amount of future capacity consumed. This results in a degraded end-user experience. When a capacity enters a throttled state, it only affects operations that are requested after the capacity has begun throttling.
Throttling policies are applied at a capacity level. If one capacity, or set of workspaces, is experiencing reduced performance due to being overloaded, other capacities can continue running normally.
Reference: https://learn.microsoft.com/en-us/fabric/data-warehouse/compute-capacity-smoothing-throttling
You are analyzing customer purchases in a Fabric notebook by using PySpark.
You have the following DataFrames:
– transactions: Contains five columns named transaction_id, customer_id, product_id, amount, and date and has 10 million rows, with each row representing a transaction.
– customers: Contains customer details in 1,000 rows and three columns named customer_id, name, and country.
You need to join the DataFrames on the customer_id column. The solution must minimize data shuffling.
You write the following code.
from pyspark.sql import functions as F
results =
Which code should you run to populate the results DataFrame?
- A . transactions.join(F.broadcast(customers), transactions.customer_id == customers.customer_id)
- B . transactions.join(customers, transactions.customer_id == customers.customer_id).distinct()
- C . transactions.join(customers, transactions.customer_id == customers.customer_id)
- D . transactions.crossJoin(customers).where(transactions.customer_id == customers.customer_id)
A
Explanation:
Broadcasting DataFrames in PySpark
In PySpark, working with small DataFrames that are used repeatedly across multiple stages in a distributed processing pipeline can cause performance issues. To optimize the performance of these operations, PySpark provides a mechanism called broadcasting.
When to Use Broadcasting
Broadcasting should be used when you have a small DataFrame that is used multiple times in your processing pipeline, especially in join operations. Broadcasting the small DataFrame can significantly improve performance by reducing the amount of data that needs to be exchanged between worker nodes.
Broadcasting DataFrames in PySpark
In PySpark, you can broadcast a DataFrame using the broadcast() function from the pyspark.sql.functions module. To use the broadcast() function, simply pass the DataFrame you want to broadcast as an argument:
Example In Pyspark
from pyspark.sql.functions import broadcast
broadcast_dataframe = broadcast(dataframe)
Using a Broadcasted DataFrame in a Join Operation
Now, let’s assume we have a larger DataFrame containing sales data and want to join it with the broadcasted DataFrame to apply the corresponding discounts:
Example In Pyspark
# Create a larger DataFrame with sales data
sales_data = [("product1", "A", 100), ("product2", "B", 200), ("product3", "C", 300)] sales_df = spark.createDataFrame(sales_data, ["product", "category", "revenue"])
# Join the sales DataFrame with the broadcasted category DataFrame result_df = sales_df.join(broadcast_category_df, on="category")
The join operation will now use the broadcasted DataFrame, significantly reducing the communication overhead and improving performance.
Note: Join
Syntax: dataframe1.join(dataframe2,dataframe1.column_name == dataframe2.column_name,”type”)
where,
dataframe1 is the first dataframe
dataframe2 is the second dataframe
column_name is the column which are matching in both the dataframes type is the join type we have to join
Incorrect:
Not B: Incorrect join syntax.
Not C: Normal working join statement. Not optimal here.
Not D: Incorrect join syntax.
Reference:
https://www.sparkcodehub.com/broadcasting-dataframes-in-pyspark
https://www.geeksforgeeks.org/pyspark-join-types-join-two-dataframes/
Prepare data
Question Set 3
You have a Fabric tenant that contains a machine learning model registered in a Fabric workspace.
You need to use the model to generate predictions by using the PREDICT function in a Fabric notebook.
Which two languages can you use to perform model scoring? Each correct answer presents a complete solution. NOTE: Each correct answer is worth one point.
- A . T-SQL
- B . DAX
- C . Spark SQL
- D . PySpark
CD
Explanation:
Machine learning model scoring with PREDICT in Microsoft Fabric
To invoke the PREDICT function, you can use the Transformer API, the Spark SQL API, or a PySpark user-defined function (UDF).
Note: Microsoft Fabric allows users to operationalize machine learning models with a scalable function called PREDICT, which supports batch scoring in any compute engine. Users can generate batch predictions directly from a Microsoft Fabric notebook or from a given ML model’s item page.
Reference: https://learn.microsoft.com/en-us/fabric/data-science/model-scoring-predict
You have a Fabric tenant that contains a semantic model.
You need to prevent report creators from populating visuals by using implicit measures.
What are two tools that you can use to achieve the goal? Each correct answer presents a complete solution. NOTE: Each correct answer is worth one point.
- A . Microsoft Power BI Desktop
- B . Tabular Editor
- C . Microsoft SQL Server Management Studio (SSMS)
- D . DAX Studio