
Microsoft DP-600 Practice Exams
Last updated on Oct 01,2026- Exam Code: DP-600
- Exam Name: Implementing Analytics Solutions Using Microsoft Fabric
- Certification Provider: Microsoft
- Latest update: Oct 01,2026
HOTSPOT
You have a Fabric tenant that contains a semantic model. The model contains data about retail stores.
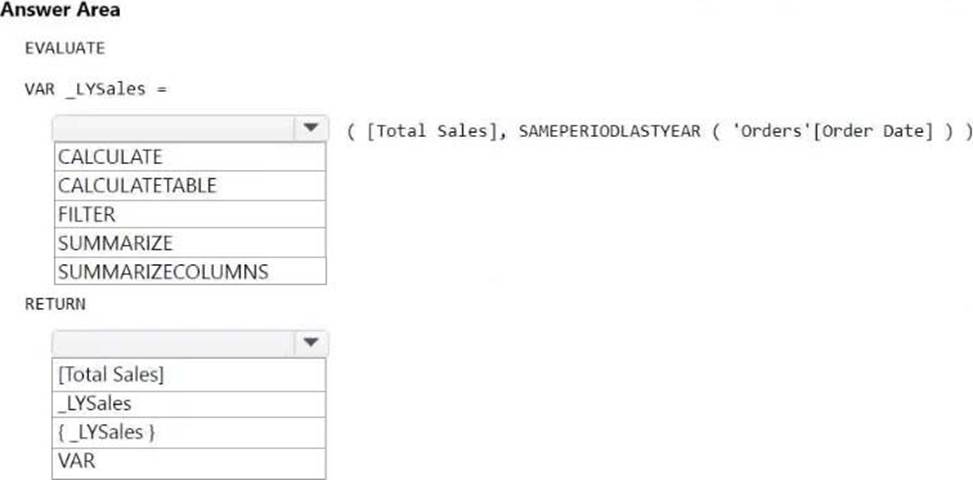
You need to write a DAX query that will be executed by using the XMLA endpoint. The query must return the total amount of sales from the same period last year.
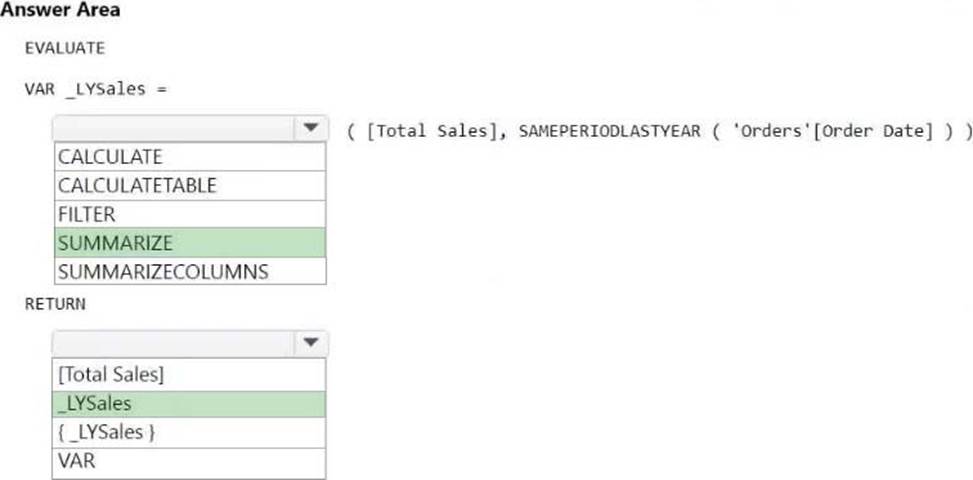
How should you complete the DAX expression? To answer, select the appropriate options in the answer area. NOTE: Each correct selection is worth one point.
Explanation:
Box 1: SUMMARIZE
SUMMARIZE
Returns a summary table for the requested totals over a set of groups.
Syntax
SUMMARIZE (<table>, <groupBy_columnName>[, <groupBy_columnName>]…[, <name>, <expression>] …)
Note: EVALUATE is a DAX statement that is needed to execute a query. EVALUATE followed by any table expression returns the result of the table expression. Moreover, one or more EVALUATE statements can be preceded by special definitions like local tables, columns, measures, and variables that have the scope of the entire batch of EVALUATE statements executed together.
— Definition section
[DEFINE { MEASURE <tableName>[<name>] = <expression> }
{ COLUMN <tableName>[<name>] = <expression> } { TABLE <tableName> = <expression> }
{ VAR <name> = <expression>}]
— Query expression
EVALUATE <table>
— Result modifiers
[ORDER BY {<expression> [{ASC | DESC}]}[, …]
[START AT {<value>|<parameter>} [, …]]]
Note 2: Example
SAMEPERIODLASTYEAR
Returns a table that contains a column of dates shifted one year back in time from the dates in the specified dates column, in the current context.
Syntax
SAMEPERIODLASTYEAR(<dates>)
Parameters
dates
A column containing dates.
Return value
A single-column table of date values.
The following sample formula creates a measure that calculates the previous year sales of Reseller sales.
= CALCULATE(SUM(ResellerSales_USD[SalesAmount_USD]), SAMEPERIODLASTYEAR(DateTime [DateKey]))
Box 2: _LYSales
Just return the variable.
Note: You can define a variable in any DAX expression by using VAR followed by RETURN. In one or several VAR sections, you individually declare the variables needed to compute the expression; in the RETURN part you provide the expression itself.
Incorrect:
* FILTER
Returns a table that represents a subset of another table or expression.
Syntax
FILTER(<table>,<filter>)
table
The table to be filtered. The table can also be an expression that results in a table.
Filter
A Boolean expression that is to be evaluated for each row of the table. For example, [Amount] > 0 or [Region] = "France"
* SUMMARIZECOLUMNS
Returns a summary table over a set of groups.
Syntax
SUMMARIZECOLUMNS( <groupBy_columnName> [, < groupBy_columnName >]…, [<filterTable>]…[, <name>, <expression>]…)
* CALCULATETABLE
Evaluates a table expression in a modified filter context.
Note
There’s also the CALCULATE function. It performs exactly the same functionality, except it modifies the filter context applied to an expression that returns a scalar value.
Syntax
CALCULATETABLE(<expression>[, <filter1> [, <filter2> [, …]]])
Reference: https://www.sqlbi.com/articles/variables-in-dax
https://dax.guide/st/evaluate/
https://learn.microsoft.com/en-us/dax/summarize-function-dax
You have a Fabric tenant that contains a lakehouse named Lakehouse1. Lakehouse1 contains a subfolder named Subfolder1 that contains CSV files.
You need to convert the CSV files into the delta format that has V-Order optimization enabled.
What should you do from Lakehouse explorer?
- A . Use the Load to Tables feature.
- B . Create a new shortcut in the Files section.
- C . Create a new shortcut in the Tables section.
- D . Use the Optimize feature.
A
Explanation:
Load to Delta Lake table
The Lakehouse in Microsoft Fabric provides a feature to efficiently load common file types to an optimized Delta table ready for analytics. The Load to Table feature allows users to load a single file or a folder of files to a table. This feature increases productivity for data engineers by allowing them to quickly use a right-click action to enable table loading on files and folders. Loading to the table is also a no-code experience, which lowers the entry bar for all personas.
Reference: https://learn.microsoft.com/en-us/fabric/data-engineering/load-to-tables
You have a Fabric tenant that contains a lakehouse named Lakehouse1. Lakehouse1 contains a subfolder named Subfolder1 that contains CSV files.
You need to convert the CSV files into the delta format that has V-Order optimization enabled.
What should you do from Lakehouse explorer?
- A . Use the Load to Tables feature.
- B . Create a new shortcut in the Files section.
- C . Create a new shortcut in the Tables section.
- D . Use the Optimize feature.
A
Explanation:
Load to Delta Lake table
The Lakehouse in Microsoft Fabric provides a feature to efficiently load common file types to an optimized Delta table ready for analytics. The Load to Table feature allows users to load a single file or a folder of files to a table. This feature increases productivity for data engineers by allowing them to quickly use a right-click action to enable table loading on files and folders. Loading to the table is also a no-code experience, which lowers the entry bar for all personas.
Reference: https://learn.microsoft.com/en-us/fabric/data-engineering/load-to-tables
Note: This question is part of a series of questions that present the same scenario. Each question in the series contains a unique solution that might meet the stated goals. Some question sets might have more than one correct solution, while others might not have a correct solution.
After you answer a question in this section, you will NOT be able to return to it. As a result, these questions will not appear in the review screen.
You have a Fabric tenant that contains a semantic model named Model1.
You discover that the following query performs slowly against Model1.
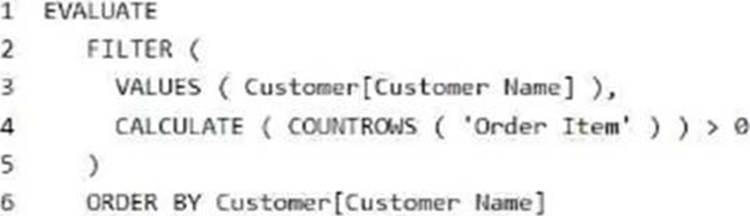
You need to reduce the execution time of the query.
Solution: You replace line 4 by using the following code:
NOT (CALCULATE (COUNTROWS (‘Order Item’)) < 0)
Does this meet the goal?
- A . Yes
- B . No
B
Explanation:
Correct: You replace line 4 by using the following code:
NOT ISEMPTY (CALCULATETABLE (‘Order Item ‘))
Just check if it is empty or not.
Note: ISEMPTY
Checks if a table is empty.
Syntax
ISEMPTY(<table_expression>)
Parameters
table_expression – A table reference or a DAX expression that returns a table.
Return value – True if the table is empty (has no rows), if else, False.
Incorrect:
* CALCULATE (COUNTROWS (‘Order Item’)) >= 0
* ISEMPTY (RELATEDTABLE (‘Order Item’))
* NOT (CALCULATE (COUNTROWS (‘Order Item’)) < 0)
Reference: https://learn.microsoft.com/en-us/dax/isempty-function-dax
HOTSPOT
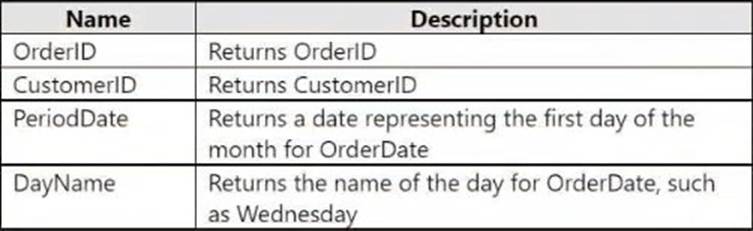
You have a Fabric warehouse that contains a table named Sales.Orders. Sales.Orders contains the following columns.
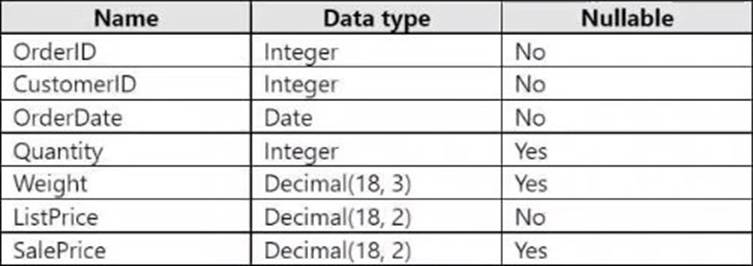
You need to write a T-SQL query that will return the following columns.
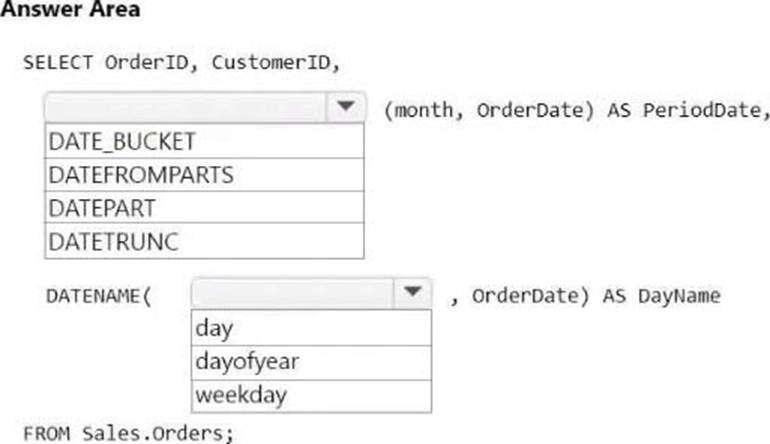
How should you complete the code? To answer, select the appropriate options in the answer area. NOTE: Each correct answer is worth one point.
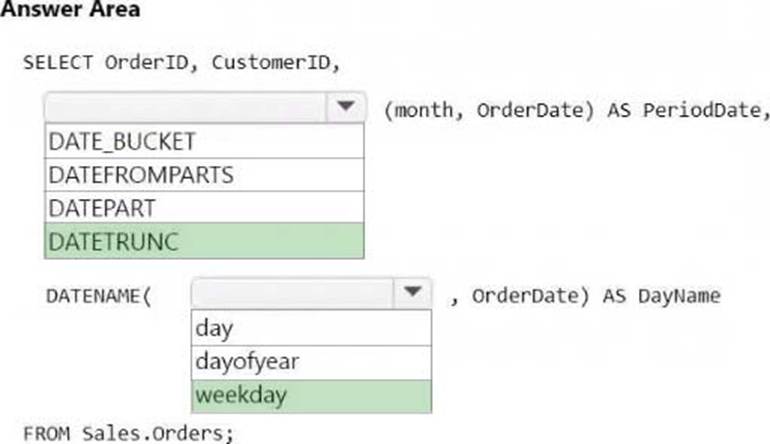
Explanation:
Box 1: DATETRUNC
QUESTION NO: NO: PeriodDate: Returns a date representing the first day of the month for OrderDate
DATETRUNC (Transact-SQL)
The DATETRUNC function returns an input date truncated to a specified datepart.
Syntax
DATETRUNC (datepart, date)
Arguments
datepart
Specifies the precision for truncation. This table lists all the valid datepart values for DATETRUNC, given that it’s also a valid part of the input date type.
Box 2: weekday
Question: DayName returns the name of the day for OrderDate, such as Wednesday
Note: DATENAME (Transact-SQL)
This function returns a character string representing the specified datepart of the specified date.
Syntax
DATENAME (datepart, date)
datepart
The specific part of the date argument that DATENAME will return. This table lists all valid datepart arguments.
weekday
Etc.
Incorrect:
* DATE_BUCKET (Transact-SQL)
This function returns the date-time value corresponding to the start of each date-time bucket from the timestamp defined by the origin parameter, or the default origin value of 1900-01-01 00:00:00.000 if the origin parameter isn’t specified.
See Date and Time Data Types and Functions (Transact-SQL) for an overview of all Transact-SQL date and time data types and functions.
Syntax
DATE_BUCKET (datepart, number, date [, origin ] )
* DATEFROMPARTS
This function returns a date value that maps to the specified year, month, and day values.
Syntax
DATEFROMPARTS (year, month, day )
* DATEPART (Transact-SQL)
This function returns an integer representing the specified datepart of the specified date.
Reference: https://learn.microsoft.com/en-us/sql/t-sql/functions/datetrunc-transact-sql
HOTSPOT
You have a Fabric workspace that uses the default Spark starter pool and runtime version 1.2.
You plan to read a CSV file named Sales_raw.csv in a lakehouse, select columns, and save the data as a Delta table to the managed area of the lakehouse. Sales_raw.csv contains 12 columns.
You have the following code.
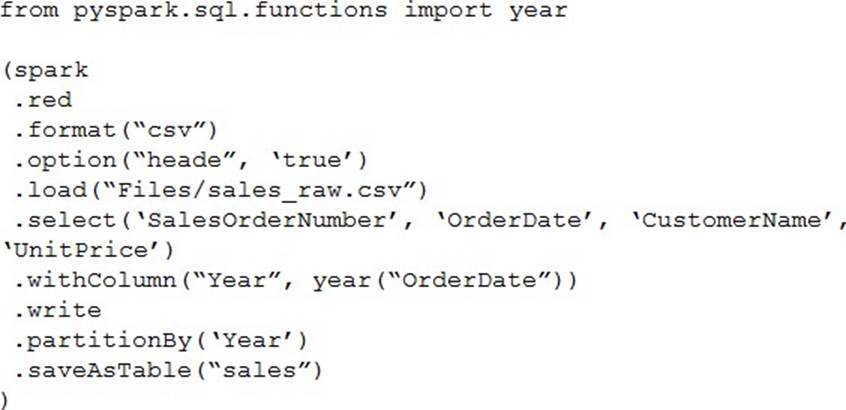
For each of the following statements, select Yes if the statement is true. Otherwise, select No. NOTE: Each correct selection is worth one point.
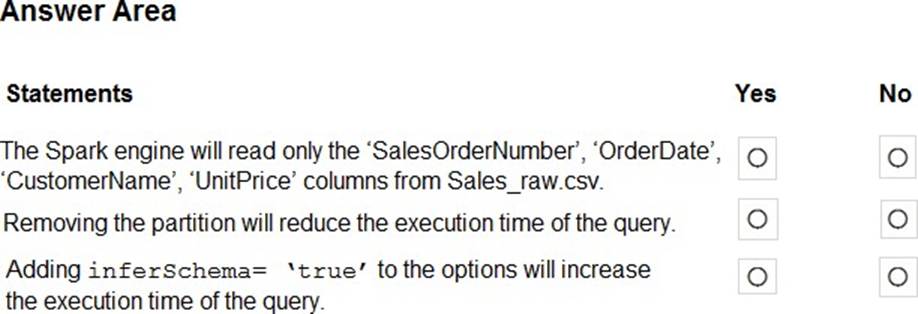
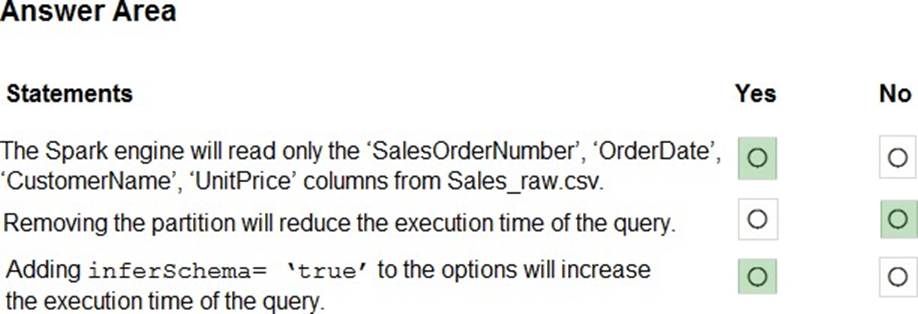
Explanation:
Box 1: Yes
PySpark Select Columns From DataFrame
In PySpark, select() function is used to select single, multiple, column by index, all columns from the list and the nested columns from a DataFrame, PySpark select() is a transformation function hence it returns a new DataFrame with the selected columns.
Select Single & Multiple Columns From PySpark
You can select the single or multiple columns of the DataFrame by passing the column names you wanted to select to the select() function. Since DataFrame is immutable, this creates a new DataFrame with selected columns. show() function is used to show the Dataframe contents.
Box 2: No
Box 3: Yes
pyspark.sql.DataFrameReader.csv
Loads a CSV file and returns the result as a DataFrame.
This function will go through the input once to determine the input schema if inferSchema is enabled. To avoid going through the entire data once, disable inferSchema option or specify the schema explicitly using schema.
Note: pyspark.sql.DataFrameWriter.saveAsTable
Saves the content of the DataFrame as the specified table.
Reference:
https://sparkbyexamples.com/pyspark/select-columns-from-pyspark-dataframe/
https://spark.apache.org/docs/latest/api/python/reference/pyspark.sql/api/pyspark.sql.DataFrameReader.csv.html
You have a Fabric tenant that contains a workspace named Workspace1 and a user named User1.
Workspace1 contains a warehouse named DW1.
You share DW1 with User1 and assign User1 the default permissions for DW1.
What can User1 do?
- A . Build reports by using the default dataset.
- B . Read data from the tables in DW1.
- C . Connect to DW1 via the Azure SQL Analytics endpoint.
- D . Read the underlying Parquet files from OneLake.
A
Explanation:
By default, when a user is granted access to a Microsoft Fabric warehouse (DW1), they receive the Viewer role.
The Viewer role allows users to:
– Build reports using the default dataset associated with the warehouse.
– Read data from the dataset but not directly from tables unless explicitly granted additional permissions.
Note: This question is part of a series of questions that present the same scenario. Each question in the series contains a unique solution that might meet the stated goals. Some question sets might have more than one correct solution, while others might not have a correct solution.
After you answer a question in this section, you will NOT be able to return to it. As a result, these questions will not appear in the review screen.
You have a Fabric tenant that contains a new semantic model in OneLake.
You use a Fabric notebook to read the data into a Spark DataFrame.
You need to evaluate the data to calculate the min, max, mean, and standard deviation values for all the string and numeric columns.
Solution: You use the following PySpark expression:
df.summary()
Does this meet the goal?
- A . Yes
- B . No
A
Explanation:
Correct Solution: You use the following PySpark expression:
df.summary()
summary(*statistics)[source]
Computes specified statistics for numeric and string columns. Available statistics are: – count – mean – stddev – min – max – arbitrary approximate percentiles specified as a percentage (eg, 75%)
If no statistics are given, this function computes count, mean, stddev, min, approximate quartiles (percentiles at 25%, 50%, and 75%), and max.
Note This function is meant for exploratory data analysis, as we make no guarantee about the backward compatibility of the schema of the resulting DataFrame.
>>> df.summary().show() +——-+——————+—–+
| stddev|2.1213203435596424| null|
Incorrect:
* df.show()
* df.explain().show()
* df.explain()
explain(extended=False)[source]
Prints the (logical and physical) plans to the console for debugging purpose.
Parameters: extended C boolean, default False. If False, prints only the physical plan.
>>> df.explain()
== Physical Plan ==
Scan ExistingRDD[age#0,name#1]
>>> df.explain(True)
== Parsed Logical Plan ==
…
== Analyzed Logical Plan ==
…
== Optimized Logical Plan ==
…
== Physical Plan ==
Reference: https://spark.apache.org/docs/2.3.0/api/python/pyspark.sql.html
HOTSPOT
You need to migrate the Research division data for Productline1. The solution must meet the data preparation requirements.
How should you complete the code? To answer, select the appropriate options in the answer area. NOTE: Each correct selection is worth one point.


Explanation:
Box 1: Delta
With Microsoft OneLake integration for semantic models, data imported into model tables can also be automatically written to Delta tables in OneLake. The Delta format is the unified table format across all compute engines in Microsoft Fabric. OneLake integration exports the data with all key performance features enabled to provide more seamless data access with higher performance.
Data scientists, database analysts, app developers, data engineers, and other data consumers can then access the same data that drives your business intelligence and financial reports in Power BI. T-SQL, Python, Scala, PySpark, Spark SQL, R, and no-code/low-code solutions can all be used to query data from Delta tables.
Box 2: Tables/productline1
How to Save a Pyspark Dataframe as a Table in a Fabric Warehouse
Example, save the dataframe result as a table in my Lakehouse.:
tf_df.write.format("delta").mode("append").save("Tables/actual_weather")
Scenario: Data Preparation Requirements
Contoso identifies the following data preparation requirements:
* The Research division data for Productline1 must be retrieved from Lakehouse1 by using Fabric notebooks.
* All the Research division data in the lakehouses must be presented as managed tables in Lakehouse explorer.
Reference:
https://learn.microsoft.com/en-us/power-bi/enterprise/onelake-integration-overview
https://medium.com/the-data-therapy/how-to-save-a-pyspark-dataframe-as-a-table-in-a-fabric-warehouse-e3b04915f066
DRAG DROP
You have a Fabric workspace that contains a Dataflow Gen2 query. The query returns the following data.

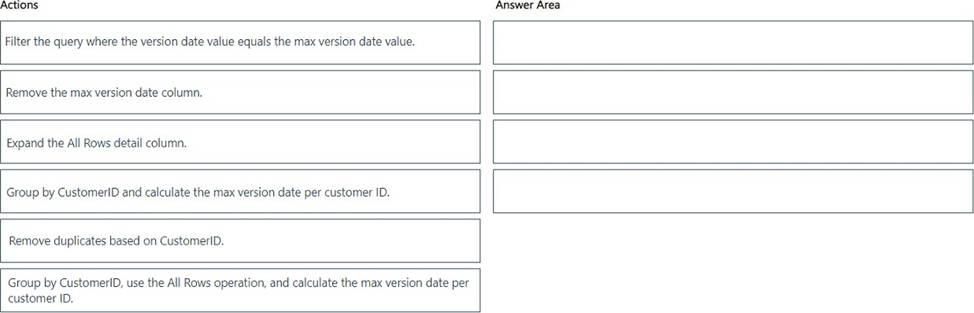
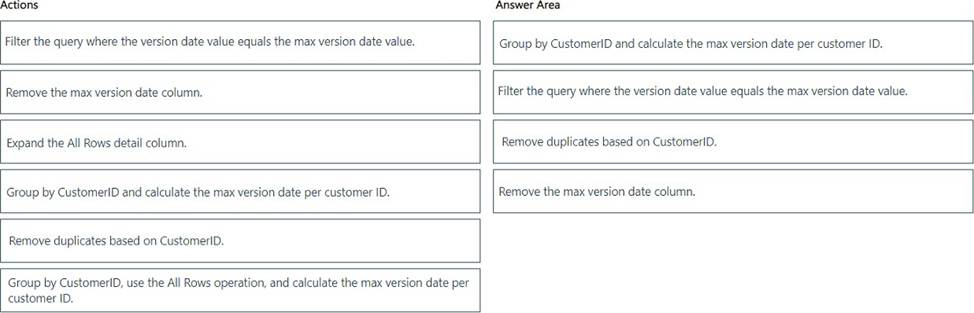
You need to filter the results to ensure that only the latest version of each customer’s record is retained.
The solution must ensure that no new columns are loaded to the semantic model.
Which four actions should you perform in sequence in Power Query Editor? To answer, move the appropriate actions from the list of actions to the answer area and arrange them in the correct order.
Explanation: