
Microsoft DP-600 Practice Exams
Last updated on Oct 01,2026- Exam Code: DP-600
- Exam Name: Implementing Analytics Solutions Using Microsoft Fabric
- Certification Provider: Microsoft
- Latest update: Oct 01,2026
Note: This question is part of a series of questions that present the same scenario. Each question in the series contains a unique solution that might meet the stated goals. Some question sets might have more than one correct solution, while others might not have a correct solution.
After you answer a question in this section, you will NOT be able to return to it. As a result, these questions will not appear in the review screen.
You have a Fabric tenant that contains a lakehouse named Lakehouse1. Lakehouse1 contains a Delta table named Customer.
When you query Customer, you discover that the query is slow to execute. You suspect that maintenance was NOT performed on the table.
You need to identify whether maintenance tasks were performed on Customer.
Solution: You run the following Spark SQL statement:
EXPLAIN TABLE customer
Does this meet the goal?
- A . Yes
- B . No
B
Explanation:
Correct Solution: You run the following Spark SQL statement:
DESCRIBE HISTORY customer
DESCRIBE HISTORY
Applies to: Databricks SQL, Databricks Runtime
Returns provenance information, including the operation, user, and so on, for each write to a table. Table history is retained for 30 days.
Syntax
DESCRIBE HISTORY table_name
Note: Work with Delta Lake table history
Each operation that modifies a Delta Lake table creates a new table version. You can use history information to audit operations, rollback a table, or query a table at a specific point in time using time travel.
Retrieve Delta table history
You can retrieve information including the operations, user, and timestamp for each write to a Delta table by running the history command. The operations are returned in reverse chronological order.
DESCRIBE HISTORY ‘/data/events/’ — get the full history of the table
DESCRIBE HISTORY delta.`/data/events/`
DESCRIBE HISTORY ‘/data/events/’ LIMIT 1 — get the last operation only
DESCRIBE HISTORY eventsTable
Incorrect:
* DESCRIBE DETAIL customer
DESCRIBE TABLE statement returns the basic metadata information of a table. The metadata information includes column name, column type and column comment. Optionally a partition spec or column name may be specified to return the metadata pertaining to a partition or column respectively.
* EXPLAIN TABLE customer
* REFRESH TABLE
REFRESH TABLE statement invalidates the cached entries, which include data and metadata of the given table or view. The invalidated cache is populated in lazy manner when the cached table or the query associated with it is executed again.
Syntax
REFRESH [TABLE] tableIdentifier
Reference: https://learn.microsoft.com/en-us/azure/databricks/sql/language-manual/delta-describe-history
https://docs.gcp.databricks.com/en/delta/history.html
https://spark.apache.org/docs/3.0.0-preview/sql-ref-syntax-aux-refresh-table.html
You have a Fabric workspace named Workspace1.
You need to create a semantic model named Model1 and publish Model1 to Workspace1.
The solution must meet the following requirements:
– Can revert to previous versions of Model1 as required.
– Identifies differences between saved versions of Model1.
– Uses Microsoft Power Bl=I Desktop to publish to Workspace1.
– Can edit item definition files by using Microsoft Visual Studio Code.
Which two actions should you perform? Each correct answer presents part of the solution. NOTE: Each correct selection is worth one point.
- A . Enable Git integration for Workspace1.
- B . Save Model1 in Power BI Desktop as a PBIT file.
- C . Enable users to edit data models in the Power BI service.
- D . Save Model1 in Power BI Desktop as a PBIP file.
AD
Explanation:
Enable Git integration for Workspace1
Git integration allows version control, enabling users to revert to previous versions and identify differences between saved versions of the semantic model.
Save Model1 in Power BI Desktop as a PBIP file
A PBIP (Power BI Project) file is a folder-based format that allows for direct editing of item definition files in Microsoft Visual Studio Code.
PBIP files are better suited for collaborative development and version control, making them the preferred choice for source control systems like Git.
HOTSPOT
You need to design a semantic model for the customer satisfaction report.
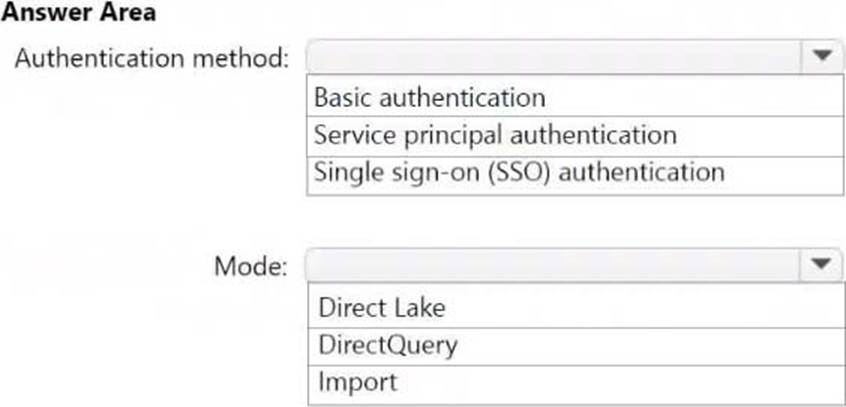
Which data source authentication method and mode should you use? To answer, select the appropriate options in the answer area. NOTE: Each correct selection is worth one point.
Explanation:
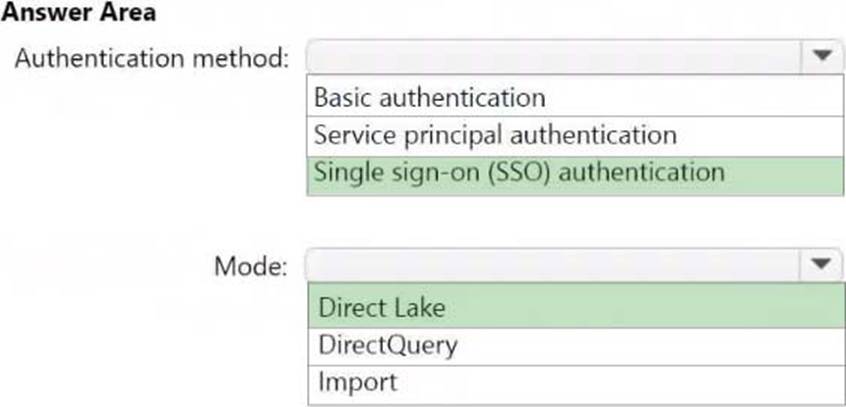
Box 1: Single sign-on (SSO) authentication
Authentication method:
Need to be able to map the user roles to the model table-level security.
Scenario:
Report:
* Ensure that the report respects any table-level security specified in the source data store.
Note: Embed a report with token-based identity (SSO)
The token-based identity allows an ISV to use a Microsoft Entra access token to pass the identity of a customer to an Azure SQL database managed in the customer’s tenant.
ISV customers that keep and manage their data in Azure SQL Database can keep their data secure in their tenant when integrating with Power BI Embedded in the ISV app.
When generating the embed token, specify the identity of the user in Azure SQL by passing that user’s Microsoft Entra access token for the Azure SQL server. The access token is then used to pull only the relevant data for that user from Azure SQL, for that specific session.
Box 2: Direct Lake
Mode:
Scenario:
Shows data as soon as the data is updated in the data store.
Minimizes the execution time of report queries.
Direct Lake mode is a groundbreaking semantic model capability for analyzing very large data volumes in Power BI. Direct Lake is based on loading parquet-formatted files directly from a data lake without having to query a Lakehouse or Warehouse endpoint, and without having to import or duplicate data into a Power BI model. Direct Lake is a fast-path to load the data from the lake straight into the Power BI engine, ready for analysis. The following diagram shows how classic import and DirectQuery modes compare with Direct Lake mode.
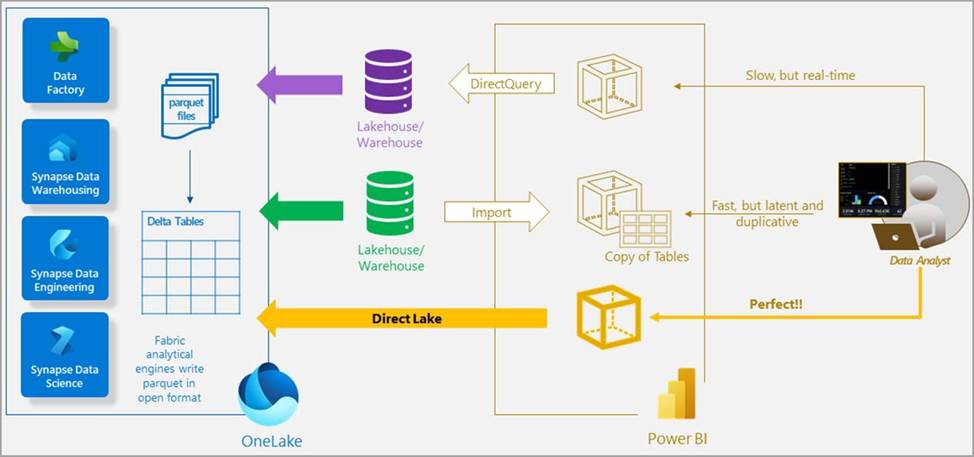
In DirectQuery mode, the Power BI engine queries the data at the source, which can be slow but avoids having to copy the data like with import mode. Any changes at the data source are immediately reflected in the query results.
On the other hand, with import mode, performance can be better because the data is cached and optimized for DAX and MDX report queries without having to translate and pass SQL or other types of queries to the data source. However, the Power BI engine must first copy any new data into the model during refresh. Any changes at the source are only picked up with the next model refresh.
Direct Lake mode eliminates the import requirement by loading the data directly from OneLake. Unlike DirectQuery, there is no translation from DAX or MDX to other query languages or query execution on other database systems, yielding performance similar to import mode. Because there’s no explicit import process, it’s possible to pick up any changes at the data source as they occur, combining the advantages of both DirectQuery and import modes while avoiding their disadvantages. Direct Lake mode can be the ideal choice for analyzing very large models and models with frequent updates at the data source.
Note Scenario:
Report Requirements
The data analysts must create a customer satisfaction report that meets the following requirements:
Enables a user to select a product to filter customer survey responses to only those who have purchased that product.
Displays the average overall satisfaction score of all the surveys submitted during the last 12 months up to a selected dat.
*-> Shows data as soon as the data is updated in the data store.
Ensures that the report and the semantic model only contain data from the current and previous year.
*-> Ensures that the report respects any table-level security specified in the source data store.
*-> Minimizes the execution time of report queries.
Reference: https://learn.microsoft.com/en-us/power-bi/developer/embedded/rls-sso
https://learn.microsoft.com/en-us/power-bi/enterprise/directlake-overview
You have a Fabric tenant that contains a workspace named Workspace1 and a user named User1. User1 is assigned the Contributor role for Workspace1.
You plan to configure Workspace1 to use an Azure DevOps repository for version control.
You need to ensure that User1 can commit items to the repository.
Which two settings should you enable for User1? Each correct answer presents part of the solution. NOTE: Each correct selection is worth one point.
- A . Users can sync workspace items with GitHub repositories
- B . Users can create and use Data workflows
- C . Users can create Fabric items
- D . Users can synchronize workspace items with their Git repositories
CD
Explanation:
To integrate Git with your Microsoft Fabric workspace, you need to set up the following prerequisites for both Fabric and Git.
Fabric prerequisites
To access the Git integration feature, you need a Fabric capacity. A Fabric capacity is required to use all supported Fabric items
In addition, the following tenant switches must be enabled from the Admin portal:
* (C) Users can create Fabric items
* (D) Users can synchronize workspace items with their Git repositories
* For GitHub users only: Users can synchronize workspace items with GitHub repositories
These switches can be enabled by the tenant admin, capacity admin, or workspace admin, depending on your organization’s settings.
Reference: https://learn.microsoft.com/en-us/fabric/cicd/git-integration/git-get-started
You need to implement the date dimension in the data store. The solution must meet the technical requirements.
What are two ways to achieve the goal? Each correct answer presents a complete solution. NOTE: Each correct selection is worth one point.
- A . Populate the date dimension table by using a dataflow.
- B . Populate the date dimension table by using a Copy activity in a pipeline.
- C . Populate the date dimension view by using T-SQL.
- D . Populate the date dimension table by using a Stored procedure activity in a pipeline.
You have a Fabric warehouse named Warehouse1 that contains a table named Table1. Table1 contains customer data.
You need to implement row-level security (RLS) for Table1. The solution must ensure that users can see only their respective data.
Which two objects should you create? Each correct answer presents part of the solution. NOTE: Each correct selection is worth one point.
- A . DATABASE ROLE
- B . STORED PROCEDURE
- C . CONSTRAINT
- D . FUNCTION
- E . SECURITY POLICY
AE
Explanation:
A database role is used to assign permissions to users or groups. In the context of RLS, you create roles that map to specific user groups or individuals, determining which rows they can access.
A security policy is used to enforce row-level security. This is done by creating a filter predicate that limits the rows returned based on a condition, such as the user’s identity or a specific column value.
You have a Fabric tenant that contains customer churn data stored as Parquet files in OneLake. The data contains details about customer demographics and product usage.
You create a Fabric notebook to read the data into a Spark DataFrame. You then create column charts in the notebook that show the distribution of retained customers as compared to lost customers based on geography, the number of products purchased, age, and customer tenure.
Which type of analytics are you performing?
- A . diagnostic
- B . descriptive
- C . prescriptive
- D . predictive
B
Explanation:
What is Customer Retention Analytics?
Customer retention analytics provide predictive metrics of which customers may churn, allowing businesses to prevent this from happening. Let us understand this by an example, by using customer retention analytics, companies can reduce churn and increase profits, as evidenced by a McKinsey report suggesting that extensive use of customer data analytics can drive profit. Customer retention metrics, including the customer retention rate, are used to measure the likelihood of retaining and attracting customers to a business. This is how data analytics helps in customer retention.
Descriptive Analytics
Descriptive analytics provide you with granular insights based on historical data. This includes tracking past purchases, customer complaints, customer service reviews, and more. In order to implement descriptive customer retention analytics, your cloud engineers would need to make sure all customer data is on-premise and up-to-date and backed up on a regular basis. Because it uses historical data to create retention strategies and personalize customer experiences, all historical data must be accessible for analysis.
Incorrect:
* Predictive Analytics
This works in tandеm with dеscriptivе analytics, which allows you to forеcast the behavior of your customers based on past data. This allows you to prеparе for specific customеr intе ractions and improv е customеr rеtеntion. For еxamplе, you can usе historical transactions to prеdict how likely a customer is to rеnеw their subscription at a music plan. Thе nеxt timе that customеr walks into thе studio, your staff will rеcеivе an alеrt to offеr additional incеntivеs to pеrsuadе thеm to rеnеw.
* Prescriptive Analytics
Prescriptive analytics finds solutions based on insights from descriptive analytics. For example, you can collect data about remedial solutions to improve retention and see how well they performed. Prescriptive analytics forces you to retrospectively evaluate all strategies to improve them. For example, a bank might use Fraud Detection. An algorithm evaluates historical data after making a purchase to see if it matches the typical level of spending. If it detects an anomaly, the bank will be notified and will recommend a course of action, such as cancelling the bank card.
* Diagnostic Analytics
Diagnostic analytics involves the collection and examination of data pertaining to a particular issue or occurrence in order to comprehend the underlying causes. Consider a scenario where a fitness app, GymFit, observes a significant drop in user engagement during a specific period. Unraveling the factors contributing to this decline becomes the focal point of diagnostic analytics. In this context, GymFit delves
into the data to uncover reasons why users might be disengaging, such as changes in workout preferences, dissatisfaction with features, or scheduling conflicts. Through careful analysis, GymFit identifies patterns and root causes behind the drop in user engagement. Armed with this knowledge, the fitness app can then implement targeted improvements, addressing concerns and enhancing the overall user experience to prevent further disengagement and attract new users.
Reference: https://emergingindiagroup.com/data-analytics-for-customer-retention/
DRAG DROP
You have a Fabric workspace named Workspace1.
You have three groups named Group1, Group2, and Group3.
You need to assign a workspace role to each group.
The solution must follow the principle of least privilege and meet the following requirements:
– Group1 must be able to write data to Workspace1, but be unable to add members to Workspace1.
– Group2 must be able to configure and maintain the settings of Workspace1.
– Group3 must be able to write data and add members to Workspace1, but be unable to delete Workspace1.
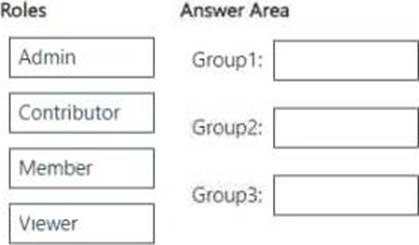
Which workspace role should you assign to each group? To answer, drag the appropriate roles to the correct groups. Each role may be used once, more than once, or not at all. You may need to drag the split bar between panes or scroll to view content. NOTE: Each correct selection is worth one point.
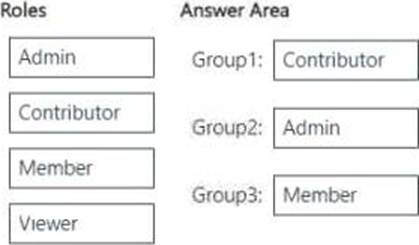
Explanation:
Group1 (Can write data but cannot add members) → Contributor
Contributors can write, edit, and manage data, but cannot manage workspace settings or add/ remove users.
Group2 (Can configure and maintain workspace settings) → Admin
Admins have full control over the workspace, including configuring settings, managing permissions, and maintaining security policies.
Group3 (Can write data and add members but cannot delete the workspace) → Member Members can add/remove members and write data, but they cannot delete the workspace or configure settings at the admin level.
You have a Fabric tenant that contains a lakehouse named LH1.
You create new tables in LH1.
You need to ensure that the tables are added automatically to the default semantic model.
What should you do?
- A . Disable Query Caching for the default semantic model.
- B . From the settings pane of LH1, enable Sync the default Power BI semantic model.
- C . Enable Refresh for the default semantic model.
- D . From the Endorsement and discovery settings of LH1, select Make discoverable.
B
Explanation:
Enabling the option to sync the default Power BI semantic model ensures that any new tables created in the lakehouse are automatically included in the semantic model. This streamlines the process of integrating data into the Power BI environment without requiring manual intervention each time a new table is added.
You need to create a data loading pattern for a Type 1 slowly changing dimension (SCD).
Which two actions should you include in the process? Each correct answer presents part of the solution. NOTE: Each correct answer is worth one point.
- A . Update rows when the non-key attributes have changed.
- B . Insert new rows when the natural key exists in the dimension table, and the non-key attribute values have changed.
- C . Update the effective end date of rows when the non-key attribute values have changed.
- D . Insert new records when the natural key is a new value in the table.