
Microsoft DP-600 Practice Exams
Last updated on Oct 01,2026- Exam Code: DP-600
- Exam Name: Implementing Analytics Solutions Using Microsoft Fabric
- Certification Provider: Microsoft
- Latest update: Oct 01,2026
You have a Fabric tenant that contains a workspace named Workspace1.
You plan to deploy a semantic model named Model1 by using the XMLA endpoint.
You need to optimize the deployment of Model1. The solution must minimize how long it takes to deploy Model1.
What should you do in Workspace1?
- A . Select Small semantic model storage format.
- B . Select Users can edit data models in the Power BI service.
- C . Set Enable Cache for Shortcuts to On.
- D . Select Large semantic model storage format.
D
Explanation:
The Large semantic model storage format is designed for handling large and complex datasets, improving the efficiency of operations like loading, processing, and deploying models. It is optimized for scalability and performance, which helps minimize the deployment time for large models.
Note: This section contains one or more sets of questions with the same scenario and problem. Each question presents a unique solution to the problem. You must determine whether the solution meets the stated goals. More than one solution in the set might solve the problem. It is also possible that none of the solutions in the set solve the problem.
After you answer a question in this section, you will NOT be able to return. As a result, these questions do not appear on the Review Screen.
Your network contains an on-premises Active Directory Domain Services (AD DS) domain named contoso.com that syncs with a Microsoft Entra tenant by using Microsoft Entra Connect.
You have a Fabric tenant that contains a semantic model.
You enable dynamic row-level security (RLS) for the model and deploy the model to the Fabric service.
You query a measure that includes the USERNAME() function, and the query returns a blank result.
You need to ensure that the measure returns the user principal name (UPN) of a user.
Solution: You add user objects to the list of synced objects in Microsoft Entra Connect.
Does this meet the goal?
- A . Yes
- B . No
You have a Fabric tenant.
You are creating a Fabric Data Factory pipeline.
You have a stored procedure that returns the number of active customers and their average sales for the current month.
You need to add an activity that will execute the stored procedure in a warehouse. The returned values must be available to the downstream activities of the pipeline.
Which type of activity should you add?
- A . Append variable
- B . Lookup
- C . Copy data
- D . KQL
B
Explanation:
The Lookup activity is specifically designed for executing queries or stored procedures and retrieving data from a data source. It allows you to capture the output from the stored procedure, making it available for use in subsequent activities within the pipeline.
This is particularly useful for scenarios where you need to process or route data based on the results returned from a stored procedure.
You have a Fabric tenant that contains a lakehouse named Lakehouse1. Lakehouse1 contains an unpartitioned table named Table1.
You plan to copy data to Table1 and partition the table based on a date column in the source data.
You create a Copy activity to copy the data to Table1.
You need to specify the partition column in the Destination settings of the Copy activity.
What should you do first?
- A . From the Destination tab, set Mode to Append.
- B . From the Destination tab, select the partition column.
- C . From the Source tab, select Enable partition discovery.
- D . From the Destination tabs, set Mode to Overwrite.
D
Explanation:
The following properties are supported for Lakehouse under the Destination tab of a copy activity.
* Under Advanced, you can specify the following fields:
– Table actions: Specify the operation against the selected table.
— Overwrite: Overwrite the existing data and schema in the table using the new values. If this operation is selected, you can enable partition on your target table:
— Enable Partition: This selection allows you to create partitions in a folder structure based on one or multiple columns. Each distinct column value (pair) is a new partition. For example, "year=2000/month=01/ file". This selection supports insert-only mode and requires an empty directory in the destination.
—-Partition column name: Select from the destination columns in schemas mapping. Supported data types are string, integer, boolean, and datetime. Format respects type conversion settings under the Mapping tab.
Incorrect:
Not A:
* Append: Append new values to existing table.
* Etc.
Not C: The following tables contain more information about a copy activity in Lakehouse.
Source information
* Enable partition discovery
Whether to parse the partitions from the file path and add them as extra source columns.
* Etc.
Reference: https://learn.microsoft.com/en-us/fabric/data-factory/connector-lakehouse-copy-activity
You have a Fabric workspace named Workspace1 and an Azure SQL database.
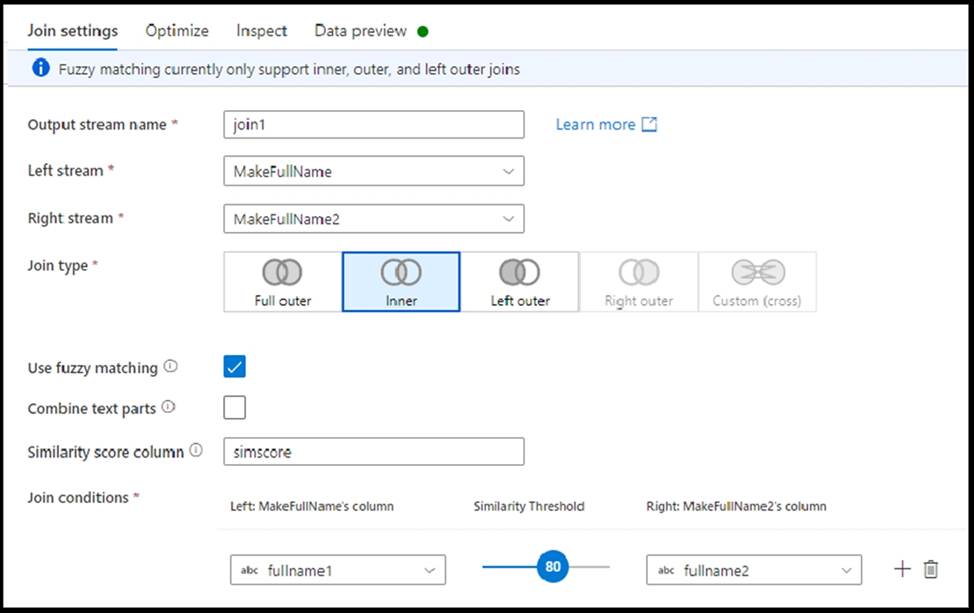
You plan to create a dataflow that will read data from the database, and then transform the data by performing an inner join.
You need to ignore spaces in the values when performing the inner join. The solution must minimize development effort.
What should you do?
- A . Append the queries by using fuzzy matching.
- B . Merge the queries by using fuzzy matching.
- C . Append the queries by using a lookup table.
- D . Merge the queries by using a lookup table.
B
Explanation:
Joins are merge operations.
Join transformation in mapping data flow
Use the join transformation to combine data from two sources or streams in a mapping data flow. The output stream will include all columns from both sources matched based on a join condition.
Inner join only outputs rows that have matching values in both tables.
Fuzzy join
You can choose to join based on fuzzy join logic instead of exact column value matching by turning on the "Use fuzzy matching" checkbox option.
*-> Combine text parts: Use this option to find matches by remove space between words. For example, Data Factory is matched with DataFactory if this option is enabled.
Similarity score column: You can optionally choose to store the matching score for each row in a column by entering a new column name here to store that value.
Similarity threshold: Choose a value between 60 and 100 as a percentage match between values in the columns you’ve selected.
Reference: https://learn.microsoft.com/en-us/azure/data-factory/data-flow-join
HOTSPOT
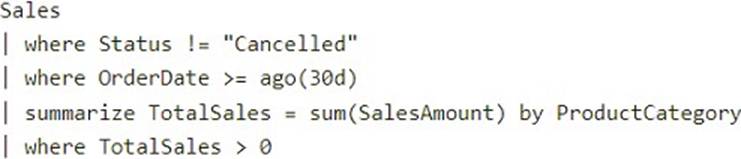
You have the following KQL query.
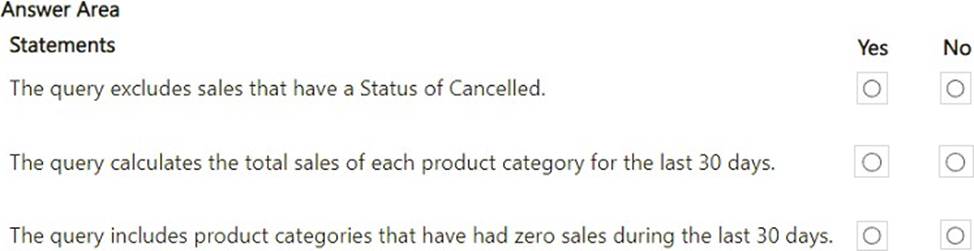
For each of the following statements, select Yes if the statement is true. Otherwise, select No. NOTE: Each correct selection is worth one point.
Explanation:
where Status != "Cancelled": Excludes records where the Status is "Cancelled".
where OrderDate >= ago(30d): Filters for records where the OrderDate is within the last 30 days.
summarize TotalSales = sum(SalesAmount) by ProductCategory: Calculates the total sales (SalesAmount) for each product category.
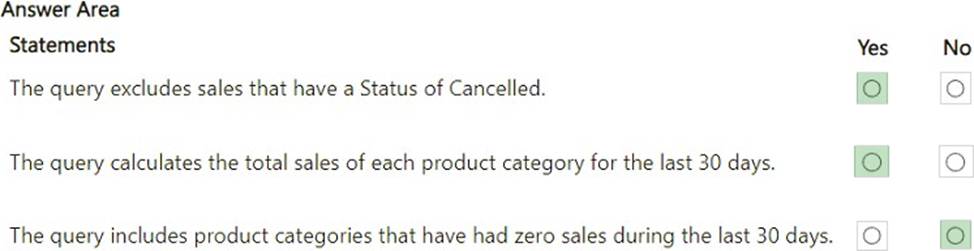
where TotalSales > 0: Filters out product categories where the total sales are zero or less. The query excludes sales that have a Status of Cancelled – Yes
The where Status != "Cancelled" condition ensures that rows with a "Cancelled" status are excluded.
The query calculates the total sales of each product category for the last 30 days – Yes The combination of where OrderDate >= ago(30d) and summarize TotalSales = sum (SalesAmount) by ProductCategory calculates the total sales for each product category for the last 30 days.
The query includes product categories that have had zero sales during the last 30 days – No The where TotalSales > 0 condition filters out product categories with zero sales.
You have a Fabric workspace named Workspace1 that contains a lakehouse named Lakehouse1.
In Workspace1, you create a data pipeline named Pipeline1.
You have CSV files stored in an Azure Storage account.
You need to add an activity to Pipeline1 that will copy data from the CSV files to Lakehouse1. The activity must support Power Query M formula language expressions.
Which type of activity should you add?
- A . Dataflow
- B . Notebook
- C . Script
- D . Copy data
A
Explanation:
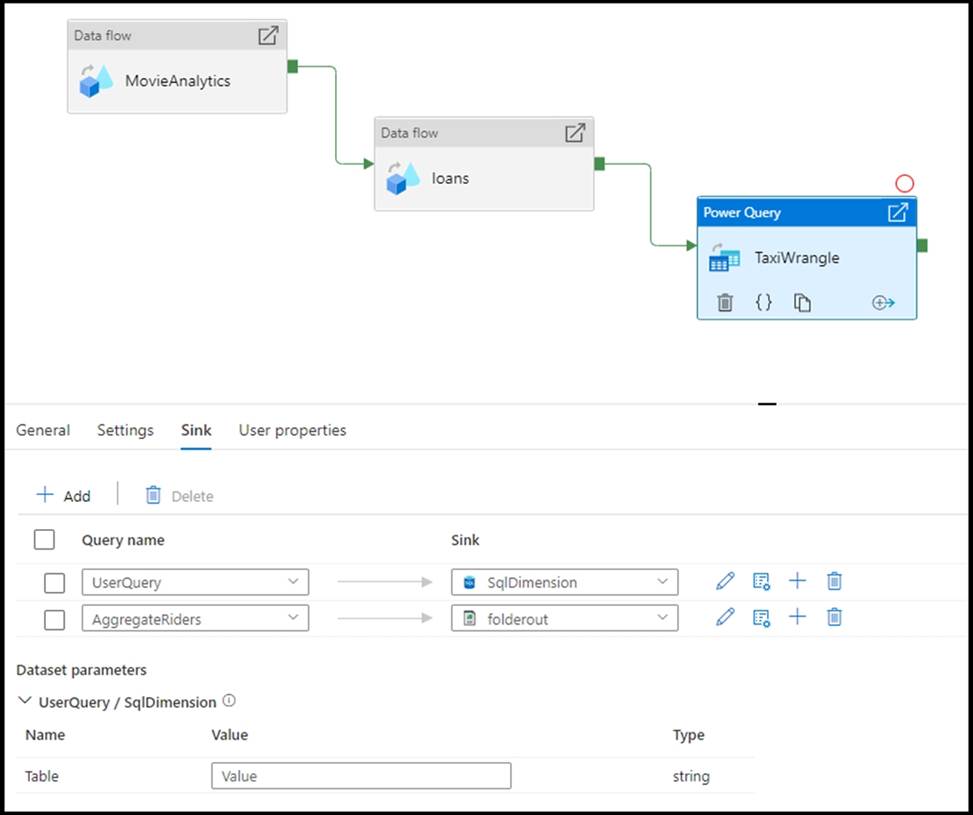
Power Query activity in Azure Data Factory
The Power Query activity allows you to build and execute Power Query mash-ups to execute data wrangling at scale in a Data Factory pipeline. You can create a new Power Query mash-up from the New resources menu option or by adding a Power Activity to your pipeline.
Translation to data flow script
To achieve scale with your Power Query activity, Azure Data Factory translates your M script into a data flow script so that you can execute your Power Query at scale using the Azure Data Factory data flow Spark environment.
Example:
Reference: https://learn.microsoft.com/en-us/azure/data-factory/control-flow-power-query-activity
You have a Fabric tenant that contains a complex semantic model. The model is based on a star schema and contains many tables, including a fact table named Sales.
You need to create a diagram of the model. The diagram must contain only the Sales table and related tables.
What should you use from Microsoft Power BI Desktop?
- A . data categories
- B . Data view
- C . Model view
- D . DAX query view
C
Explanation:
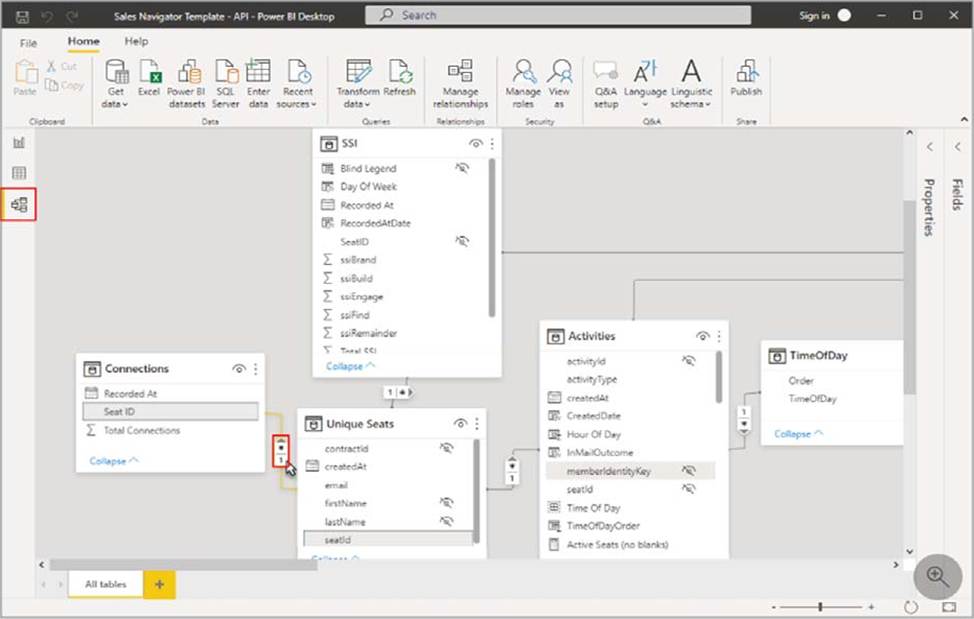
Model view in Power BI Desktop
Model view shows all of the tables, columns, and relationships in your model. This view can be especially helpful when your model has complex relationships between many tables.
Select the Model view icon near the side of the window to see a view of the existing model. Hover your cursor over a relationship line to show the columns used.
Reference: https://learn.microsoft.com/en-us/power-bi/transform-model/desktop-relationship-view
You have a Fabric tenant that contains a complex semantic model. The model is based on a star schema and contains many tables, including a fact table named Sales.
You need to create a diagram of the model. The diagram must contain only the Sales table and related tables.
What should you use from Microsoft Power BI Desktop?
- A . data categories
- B . Data view
- C . Model view
- D . DAX query view
C
Explanation:
Model view in Power BI Desktop
Model view shows all of the tables, columns, and relationships in your model. This view can be especially helpful when your model has complex relationships between many tables.
Select the Model view icon near the side of the window to see a view of the existing model. Hover your cursor over a relationship line to show the columns used.
Reference: https://learn.microsoft.com/en-us/power-bi/transform-model/desktop-relationship-view
You have a Fabric tenant that contains a complex semantic model. The model is based on a star schema and contains many tables, including a fact table named Sales.
You need to create a diagram of the model. The diagram must contain only the Sales table and related tables.
What should you use from Microsoft Power BI Desktop?
- A . data categories
- B . Data view
- C . Model view
- D . DAX query view
C
Explanation:
Model view in Power BI Desktop
Model view shows all of the tables, columns, and relationships in your model. This view can be especially helpful when your model has complex relationships between many tables.
Select the Model view icon near the side of the window to see a view of the existing model. Hover your cursor over a relationship line to show the columns used.
Reference: https://learn.microsoft.com/en-us/power-bi/transform-model/desktop-relationship-view