
Microsoft DP-600 Practice Exams
Last updated on Oct 03,2026- Exam Code: DP-600
- Exam Name: Implementing Analytics Solutions Using Microsoft Fabric
- Certification Provider: Microsoft
- Latest update: Oct 03,2026
HOTSPOT
You have a Fabric workspace that contains a warehouse named DW1.
DW1 contains the following tables and columns.
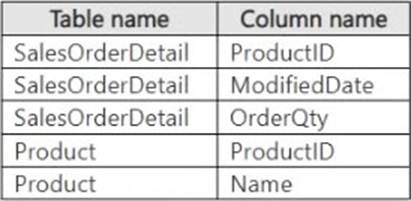
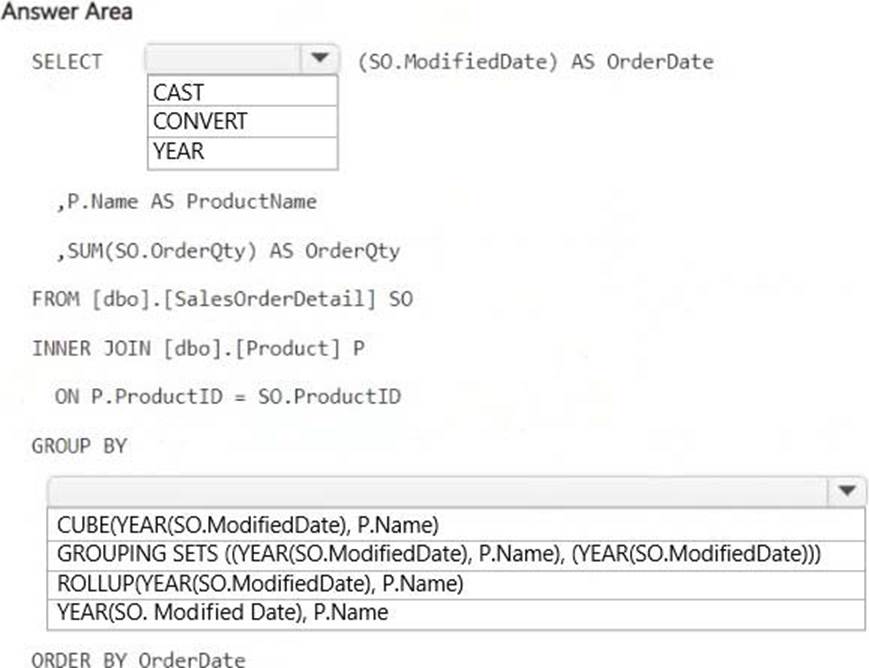
You need to summarize order quantities by year and product. The solution must include the yearly sum of order quantities for all the products in each row.
How should you complete the T-SQL statement? To answer, select the appropriate options in the answer area. NOTE: Each correct selection is worth one point.
Explanation:
YEAR(SO.ModifiedDate)
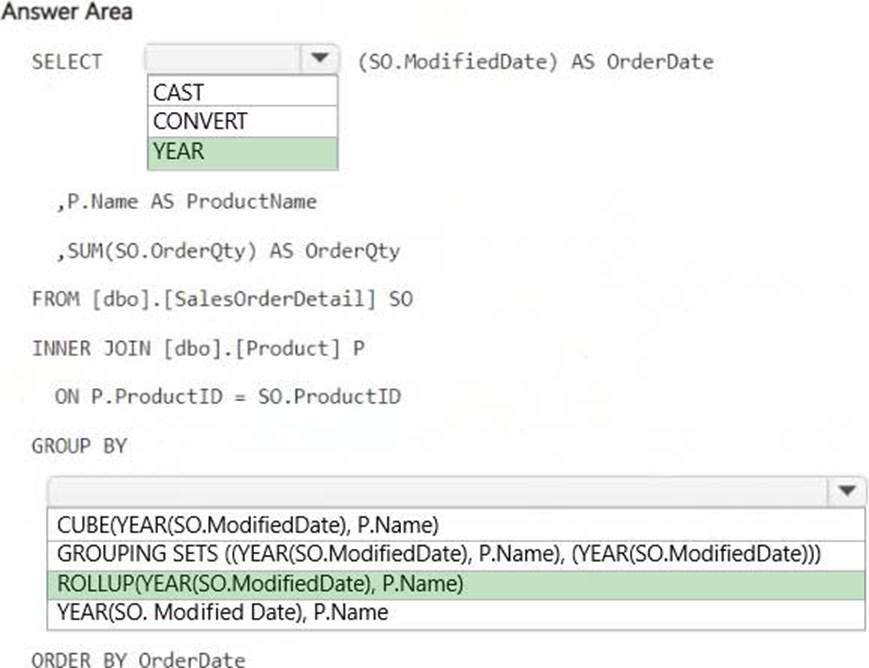
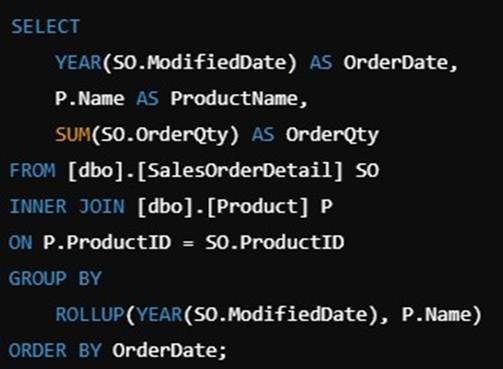
Extracts the year from the ModifiedDate column to aggregate order quantities by year.
ROLLUP(YEAR(SO.ModifiedDate), P.Name)
The ROLLUP function generates subtotal rows:
– Summarized total order quantity per product per year.
– Overall total order quantity per year (product subtotal).
You have a Fabric tenant that contains a lakehouse.
You plan to use a visual query to merge two tables.
You need to ensure that the query returns all the rows in both tables.
Which type of join should you use?
- A . inner
- B . full outer
- C . left outer
- D . right anti
- E . right outer
- F . left anti
B
Explanation:
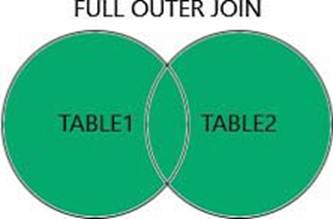
The FULL OUTER JOIN keyword returns all records when there is a match in left (table1) or right (table2) table records.
Reference: https://www.w3schools.com/sql/sql_join_full.asp
You have a Fabric tenant that contains a lakehouse.
You plan to use a visual query to merge two tables.
You need to ensure that the query returns all the rows in both tables.
Which type of join should you use?
- A . inner
- B . full outer
- C . left outer
- D . right anti
- E . right outer
- F . left anti
B
Explanation:
The FULL OUTER JOIN keyword returns all records when there is a match in left (table1) or right (table2) table records.
Reference: https://www.w3schools.com/sql/sql_join_full.asp
HOTSPOT
You have a Fabric warehouse that contains two tables named DimDate and Trips.
DimDate contains the following fields.

Trips contains the following fields.

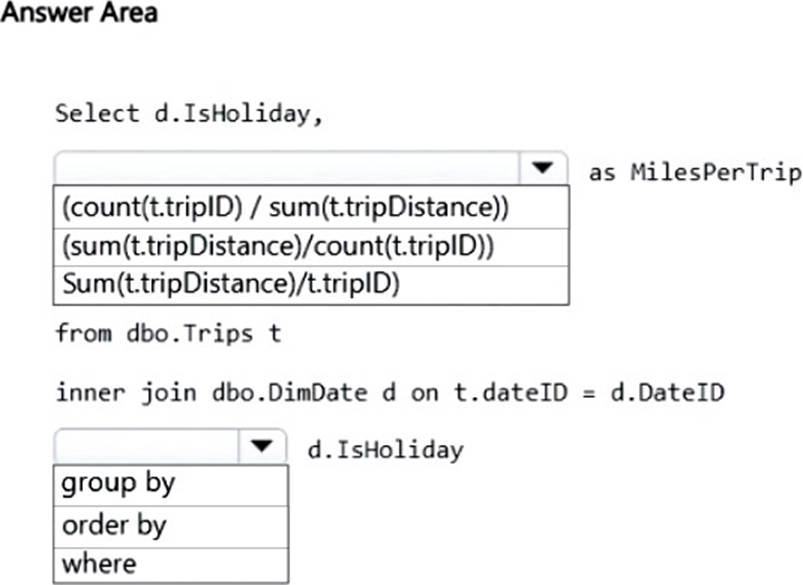
You need to compare the average miles per trip for statutory holidays versus non-statutory holidays.
How should you complete the T-SQL statement? To answer, select the appropriate options in the answer area. NOTE: Each correct selection is worth one point.
Explanation:
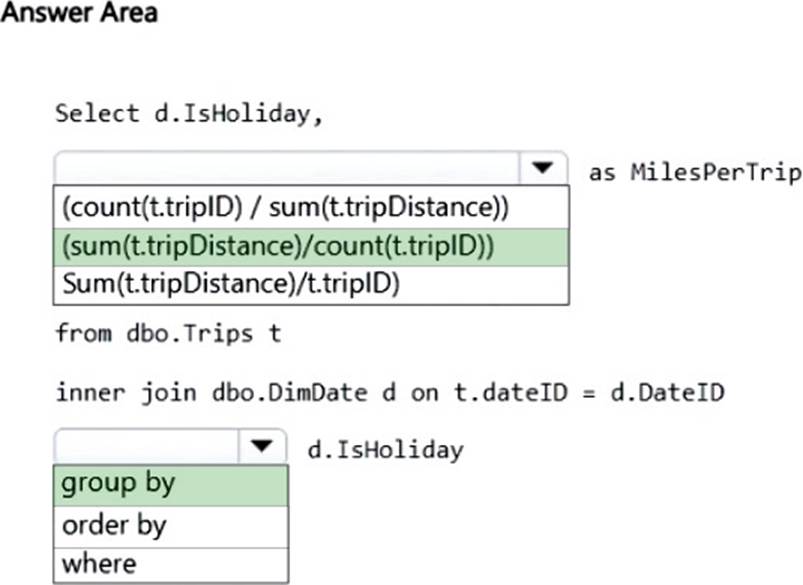
Box 1: (Sum(t.tripDistance)/count(t.tripID))
average miles per trip
total miles: Sum(t.tripDistance)
number of trips: count(t.tripID)
Box 2: group by
Group by on the Holiday column to get results for both statutory holidays and non-statutory holidays.
You have a Fabric workspace named Workspace1 that contains a lakehouse named Lakehouse1.
Lakehouse1 contains a table named Table1.
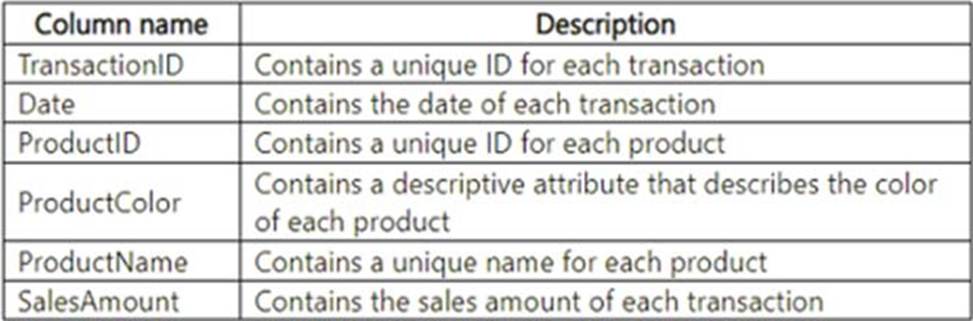
Table1 contains the following data.
You need to perform the following actions:
– Load the data from Table1 into a star schema.
– Create a product dimension table named DimProduct and a fact table named FactSales.
Which three columns should you include in DimProduct?
- A . ProductColor, ProductID, and ProductName.
- B . ProductName, SalesAmount, and TransactionlD.
- C . Date, ProductID, and TransactionlD.
- D . ProductID, ProductName, and SalesAmount
A
Explanation:
DimProduct is the product dimension table, so it should include attributes that describe the product:
ProductID: A unique identifier for the product (acts as the key for the dimension table).
– ProductName: Describes the name of the product.
– ProductColor: Describes the product’s color.
You have a Fabric tenant that uses a Microsoft Power BI Premium capacity.
You need to enable scale-out for a semantic model.
What should you do first?
- A . At the semantic model level, set Large Semantic model storage format to Off.
- B . At the tenant level, set Create and use Metrics to Enabled.
- C . At the semantic model level, set Large Semantic model storage format to On.
- D . At the tenant level, set Data Activator to Enabled.
C
Explanation:
Power BI semantic model scale-out
Prerequisites
By default, scale-out is enabled for your tenant, but it’s not enabled for semantic models in your tenant. To enable scale-out for a semantic model, you must use the Power BI REST APIs. Before enabling, the
following prerequisites must be met:
* The Scale-out queries for large semantic models setting for your tenant is enabled (default).
* Your workspace resides on a Power BI Premium capacity
*-> The Large semantic model storage format setting is enabled.
* Etc.
Note: Power BI semantic models can store data in a highly compressed in-memory cache for optimized query performance, enabling fast user interactivity. With Premium capacities, large semantic models beyond the default limit can be enabled with the Large semantic model storage format setting. When enabled, semantic model size is limited by the Premium capacity size or the maximum size set by the administrator.
Enable large semantic models
Steps here describe enabling large semantic models for a new model published to the service. For existing semantic models, only step 3 is necessary.
HOTSPOT
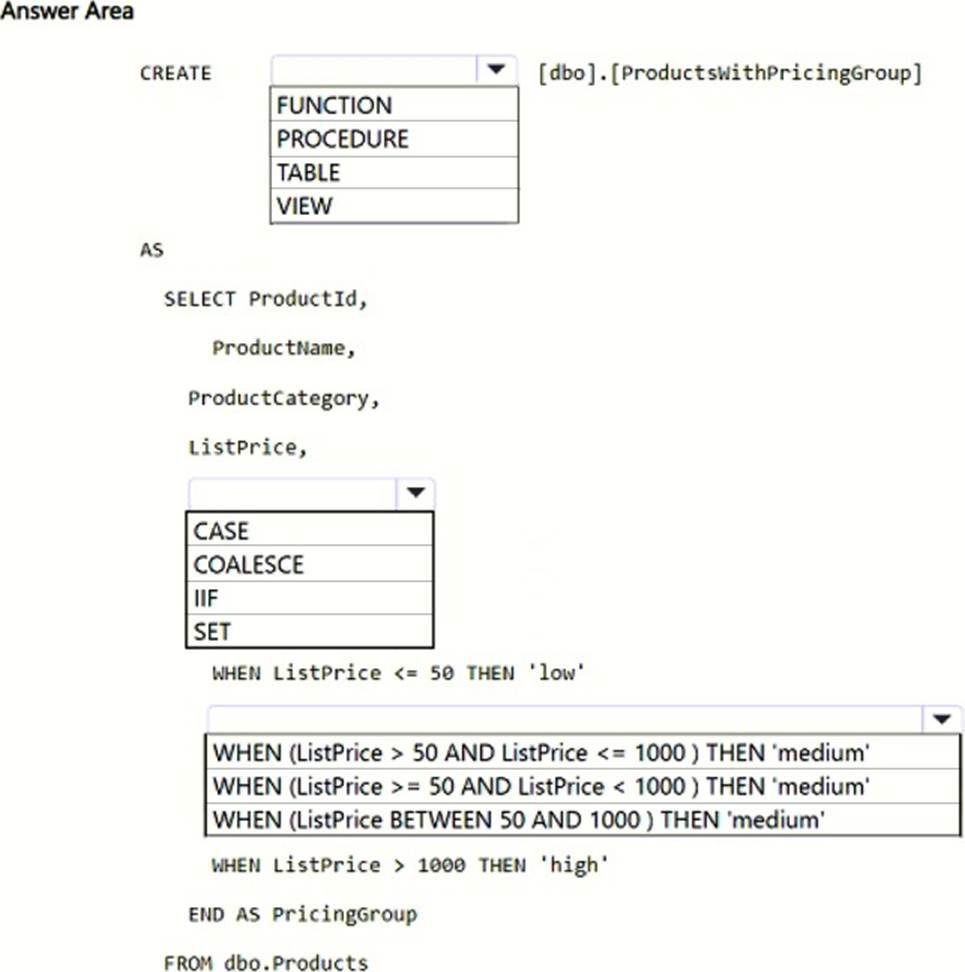
You need to resolve the issue with the pricing group classification.
How should you complete the T-SQL statement? To answer, select the appropriate options in the answer area. NOTE: Each correct selection is worth one point.
Explanation:
Scenario:
Product data is often classified into three pricing groups: high, medium, and low. This logic is implemented in several databases and semantic models, but the logic does NOT always match across implementations.
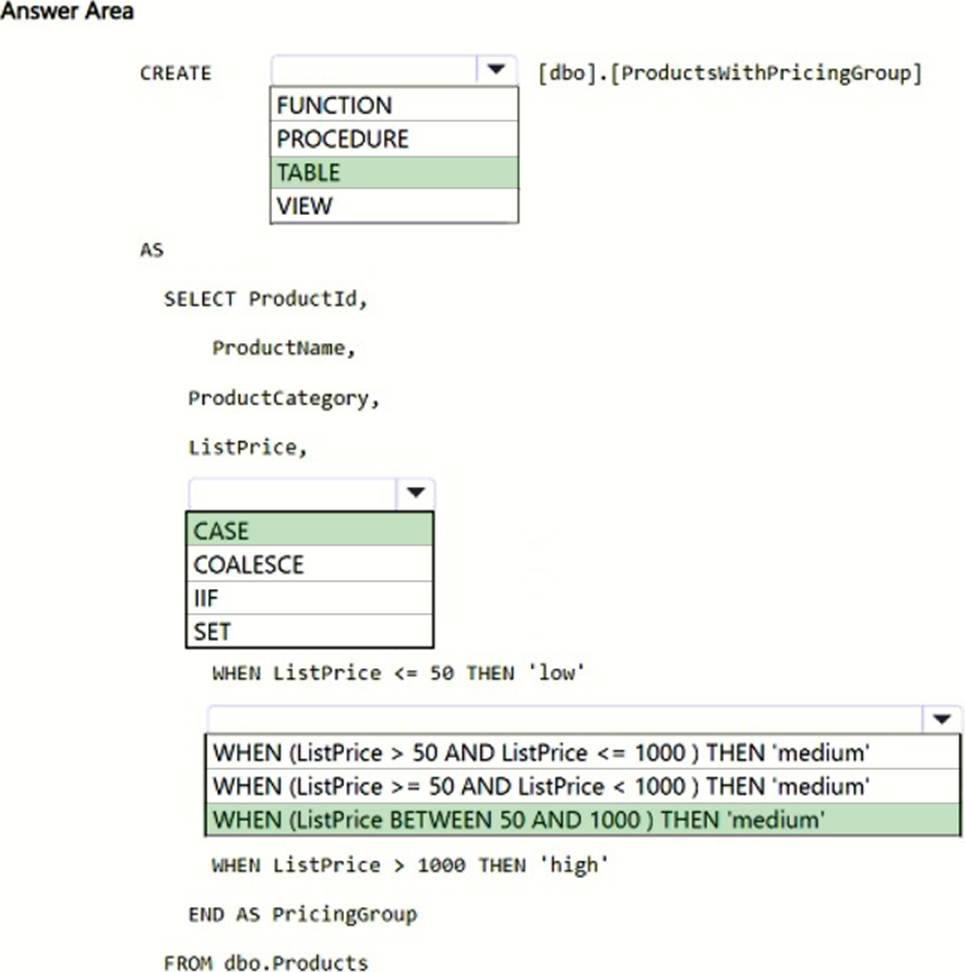
Box 1: TABLE
CREATE TABLE AS SELECT
The CREATE TABLE AS SELECT (CTAS) statement is one of the most important T-SQL features available. CTAS is a parallel operation that creates a new table based on the output of a SELECT statement. CTAS is the simplest and fastest way to create and insert data into a table with a single command.
Box 2: CASE Syntax
Syntax for SQL Server, Azure SQL Database and Azure Synapse Analytics.
— Simple CASE expression: CASE input_expression
WHEN when_expression THEN result_expression [ …n ]
[ ELSE else_result_expression ]
END
Box 3: WHEN (ListPrice BETWEEN 50 AND 1000) THEN ‘medium’ Must use an expression that includes 1000 in medium.
Note: BETWEEN returns TRUE if the value of test_expression is greater than or equal to the value of begin_expression and less than or equal to the value of end_expression.
Reference: https://learn.microsoft.com/en-us/azure/synapse-analytics/sql-data-warehouse/sql-data-warehouse-develop-ctas
HOTSPOT
You need to resolve the issue with the pricing group classification.
How should you complete the T-SQL statement? To answer, select the appropriate options in the answer area. NOTE: Each correct selection is worth one point.
Explanation:
Scenario:
Product data is often classified into three pricing groups: high, medium, and low. This logic is implemented in several databases and semantic models, but the logic does NOT always match across implementations.
Box 1: TABLE
CREATE TABLE AS SELECT
The CREATE TABLE AS SELECT (CTAS) statement is one of the most important T-SQL features available. CTAS is a parallel operation that creates a new table based on the output of a SELECT statement. CTAS is the simplest and fastest way to create and insert data into a table with a single command.
Box 2: CASE Syntax
Syntax for SQL Server, Azure SQL Database and Azure Synapse Analytics.
— Simple CASE expression: CASE input_expression
WHEN when_expression THEN result_expression [ …n ]
[ ELSE else_result_expression ]
END
Box 3: WHEN (ListPrice BETWEEN 50 AND 1000) THEN ‘medium’ Must use an expression that includes 1000 in medium.
Note: BETWEEN returns TRUE if the value of test_expression is greater than or equal to the value of begin_expression and less than or equal to the value of end_expression.
Reference: https://learn.microsoft.com/en-us/azure/synapse-analytics/sql-data-warehouse/sql-data-warehouse-develop-ctas
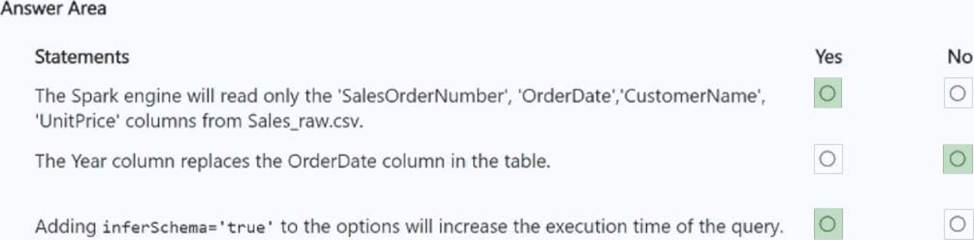
HOTSPOT
You have a Fabric workspace that uses the default Spark starter pool and runtime version 1.2.
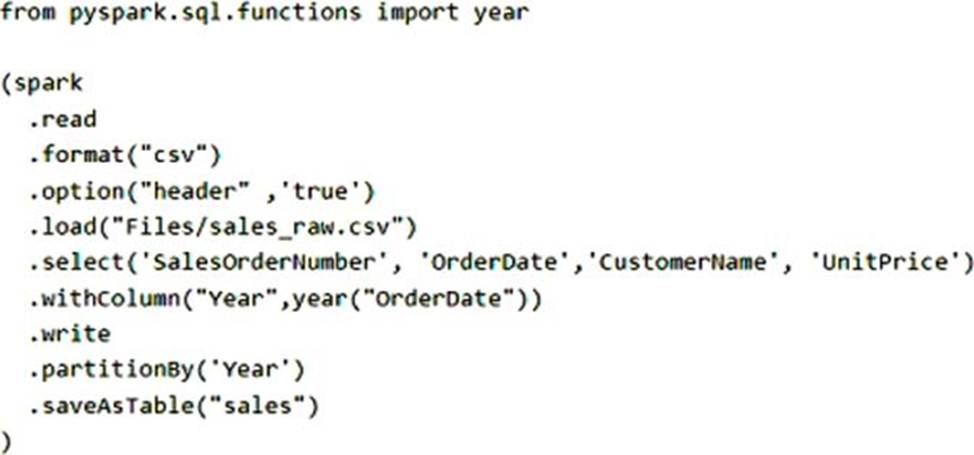
You plan to read a CSV file named Sales_raw.csv in a lakehouse, select columns, and save the data as a Delta table to the managed area of the lakehouse. Sales_raw.csv contains 12 columns.
You have the following code.
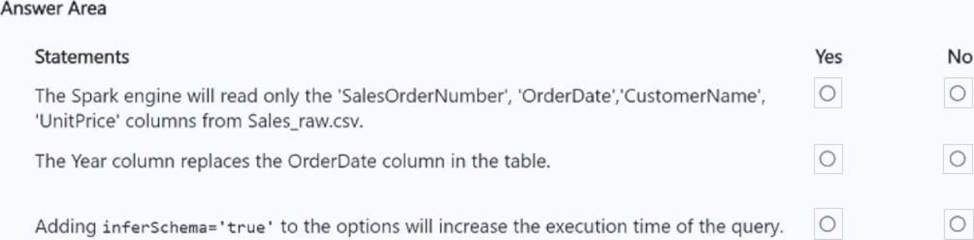
For each of the following statements, select Yes if the statement is true. Otherwise, select No. NOTE: Each correct selection is worth one point.
Explanation:
Box 1: Yes
Yes – The Spark engine will read only the ‘SalesOrderNumber’,’OrderDate’,’CustomerName’,’UnitPrice’
columns from Sales_raw.csv.
Note:
DataFrame.select(*cols: ColumnOrName) → DataFrame[source] Projects a set of expressions and returns a new DataFrame
Parameters
colsstr, Column, or list
column names (string) or expressions (Column). If one of the column names is ‘*’, that column is expanded to include all columns in the current DataFrame.
Box 2: No
No – The Year column replaces the OrderDate column in the table.
withColumn adds one extra column
Note: pyspark.sql.dataframe.DataFrame[source]
Returns a new DataFrame by adding multiple columns or replacing the existing columns that have the same names.
The colsMap is a map of column name and column, the column must only refer to attributes supplied by this Dataset. It is an error to add columns that refer to some other Dataset.
Box 3: Yes
Yes – Adding inferSchema=’true’ to the options will increase the execution time of the query.
When you set inferSchema to True, PySpark will make an additional pass over the data to determine the data types of each column. This can be useful when you don’t have a predefined schema for your data and want Spark to automatically deduce the types based on the actual data values.
Reference:
https://spark.apache.org/docs/latest/api/python/reference/pyspark.sql/api/pyspark.sql.DataFrame.select.html
https://spark.apache.org/docs/latest/api/python/reference/pyspark.sql/api/pyspark.sql.DataFrame.withColumns.html
https://medium.com/@sujathamudadla1213/what-are-the-considerations-and-implications-of-setting-inferschema-to-true-and-false-in-pyspark-9fc77fa2ad9a
You have a Fabric tenant that contains a semantic model.
You need to modify object-level security (OLS) for the model.
What should you use?
- A . the Fabric service
- B . Microsoft Power BI Desktop
- C . ALM Toolkit
- D . Tabular Editor
D
Explanation:
Microsoft Fabric Security, Object-level security (OLS)
To create roles on Power BI Desktop semantic models, use external tools such as Tabular Editor.
Configure object-level security using tabular editor