
Microsoft DP-600 Practice Exams
Last updated on Oct 03,2026- Exam Code: DP-600
- Exam Name: Implementing Analytics Solutions Using Microsoft Fabric
- Certification Provider: Microsoft
- Latest update: Oct 03,2026
You have a Fabric workspace named Workspace1 that contains a data flow named Dataflow1.
Dataflow1 contains a query that returns the data shown in the following exhibit.
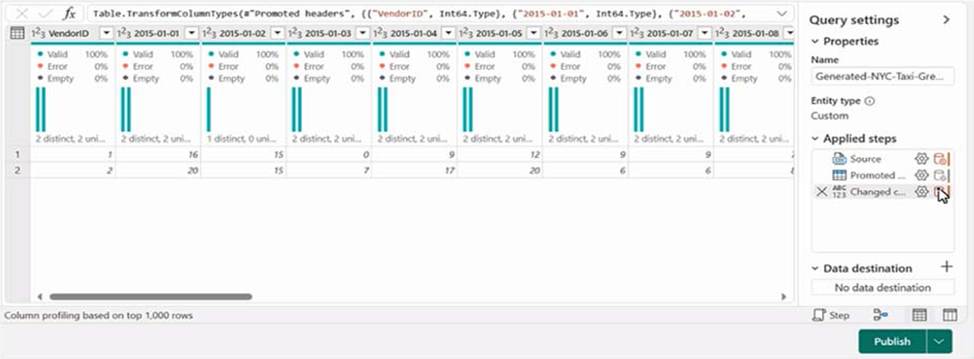
You need to transform the date columns into attribute-value pairs, where columns become rows.
You select the VendorID column.
Which transformation should you select from the context menu of the VendorID column?
- A . Group by
- B . Unpivot columns
- C . Unpivot other columns
- D . Split column
- E . Remove other columns
C
Explanation:
For the VendorID column we see: 2 distinct, 2 unique
Unpivot columns
In Power Query, you can transform columns into attribute-value pairs, where columns become rows.
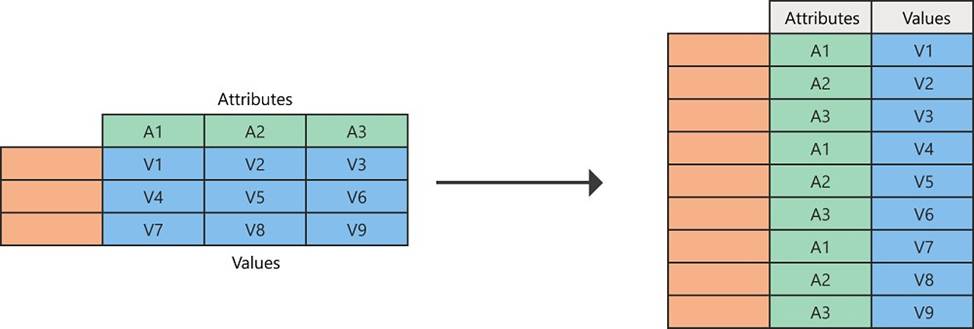
For example, given a table like the following, where country rows and date columns create a matrix of values, it’s difficult to analyze the data in a scalable way.
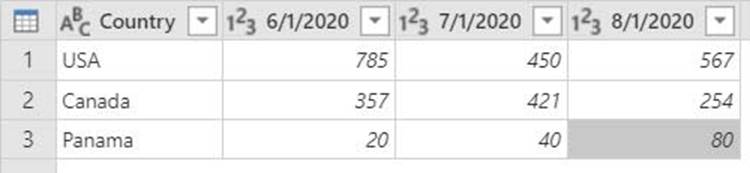
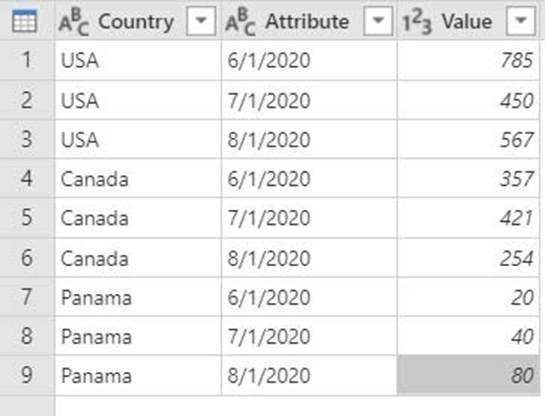
Instead, you can transform the table into a table with unpivoted columns, as shown in the following image.
In the transformed table, it’s easier to use the date as an attribute to filter on.
Unpivot other columns
You can select the columns that you don’t want to unpivot and unpivot the rest of the columns in the table.
This operation is where Unpivot other columns comes into play.
Reference: https://learn.microsoft.com/en-us/power-query/unpivot-column
Note: This question is part of a series of questions that present the same scenario. Each question in the series contains a unique solution that might meet the stated goals. Some question sets might have more than one correct solution, while others might not have a correct solution.
After you answer a question in this section, you will NOT be able to return to it. As a result, these questions will not appear in the review screen.
You have a Fabric tenant that contains a lakehouse named Lakehouse1. Lakehouse1 contains a Delta table named Customer.
When you query Customer, you discover that the query is slow to execute. You suspect that maintenance was NOT performed on the table.
You need to identify whether maintenance tasks were performed on Customer.
Solution: You run the following Spark SQL statement:
REFRESH TABLE customer
Does this meet the goal?
- A . Yes
- B . No
B
Explanation:
Correct Solution: You run the following Spark SQL statement:
DESCRIBE HISTORY customer
DESCRIBE HISTORY
Applies to: Databricks SQL, Databricks Runtime
Returns provenance information, including the operation, user, and so on, for each write to a table. Table history is retained for 30 days.
Syntax
DESCRIBE HISTORY table_name
Note: Work with Delta Lake table history
Each operation that modifies a Delta Lake table creates a new table version. You can use history information to audit operations, rollback a table, or query a table at a specific point in time using time travel.
Retrieve Delta table history
You can retrieve information including the operations, user, and timestamp for each write to a Delta table by running the history command. The operations are returned in reverse chronological order.
DESCRIBE HISTORY ‘/data/events/’ — get the full history of the table
DESCRIBE HISTORY delta.`/data/events/`
DESCRIBE HISTORY ‘/data/events/’ LIMIT 1 — get the last operation only
DESCRIBE HISTORY eventsTable
Incorrect:
* DESCRIBE DETAIL customer
DESCRIBE TABLE statement returns the basic metadata information of a table. The metadata information includes column name, column type and column comment. Optionally a partition spec or column name may be specified to return the metadata pertaining to a partition or column respectively.
* EXPLAIN TABLE customer
* REFRESH TABLE
REFRESH TABLE statement invalidates the cached entries, which include data and metadata of the given table or view. The invalidated cache is populated in lazy manner when the cached table or the query associated with it is executed again.
Syntax
REFRESH [TABLE] tableIdentifier
Reference: https://learn.microsoft.com/en-us/azure/databricks/sql/language-manual/delta-describe-history
https://docs.gcp.databricks.com/en/delta/history.html
https://spark.apache.org/docs/3.0.0-preview/sql-ref-syntax-aux-refresh-table.html
DRAG DROP
You are building a solution by using a Fabric notebook.
You have a Spark DataFrame assigned to a variable named df. The DataFrame returns four columns.
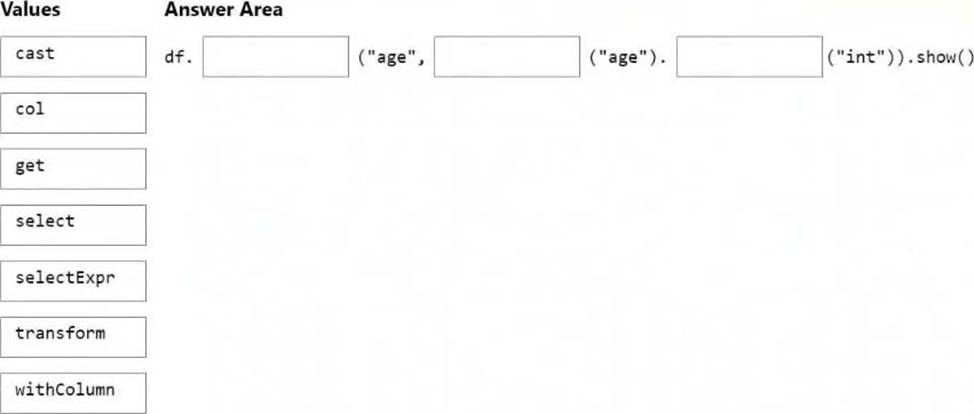
You need to change the data type of a string column named Age to integer. The solution must return a DataFrame that includes all the columns.
How should you complete the code? To answer, drag the appropriate values to the correct targets. Each value may be used once, more than once, or not at all. You may need to drag the split bar between panes or scroll to view content. NOTE: Each correct selection is worth one point.
Explanation:
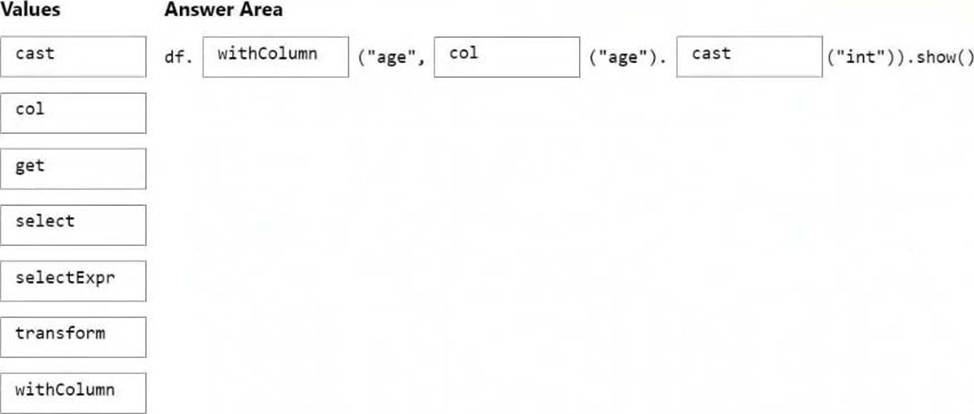
Box 1: withColumn
In PySpark, we can use the cast method to change the data type.
from pyspark.sql.types import IntegerType
from pyspark.sql import functions as F
# first method
df = df.withColumn("Age", df.age.cast("int"))
# second method
df = df.withColumn("Age", df.age.cast(IntegerType()))
# third method <– This one
df = df.withColumn("Age", F.col("Age").cast(IntegerType()))
Box 2: col
Box 3: cast
Reference: https://www.aporia.com/resources/how-to/change-column-data-types-in-dataframe/
DRAG DROP
You are building a solution by using a Fabric notebook.
You have a Spark DataFrame assigned to a variable named df. The DataFrame returns four columns.
You need to change the data type of a string column named Age to integer. The solution must return a DataFrame that includes all the columns.
How should you complete the code? To answer, drag the appropriate values to the correct targets. Each value may be used once, more than once, or not at all. You may need to drag the split bar between panes or scroll to view content. NOTE: Each correct selection is worth one point.
Explanation:
Box 1: withColumn
In PySpark, we can use the cast method to change the data type.
from pyspark.sql.types import IntegerType
from pyspark.sql import functions as F
# first method
df = df.withColumn("Age", df.age.cast("int"))
# second method
df = df.withColumn("Age", df.age.cast(IntegerType()))
# third method <– This one
df = df.withColumn("Age", F.col("Age").cast(IntegerType()))
Box 2: col
Box 3: cast
Reference: https://www.aporia.com/resources/how-to/change-column-data-types-in-dataframe/
HOTSPOT
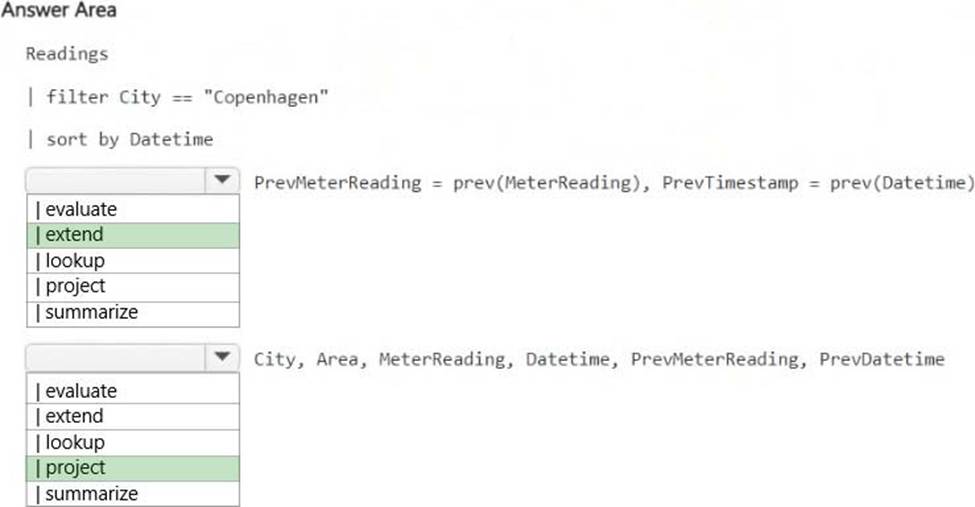
You have a KQL database that contains a table named Readings.
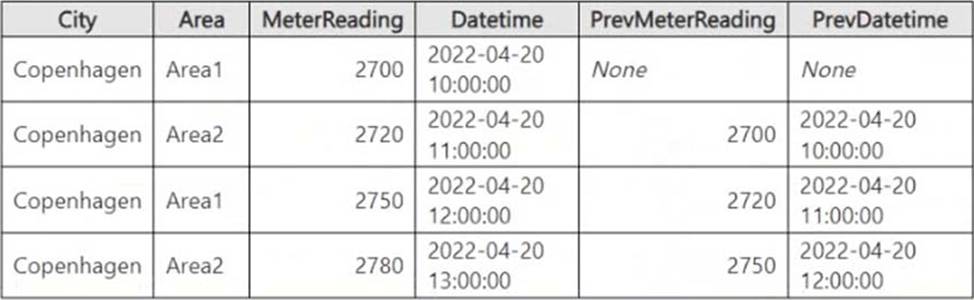
You need to query Readings and return the results shown in the following table.
How should you complete the query? To answer, select the appropriate options in the answer area. NOTE: Each correct selection is worth one point.
Explanation:
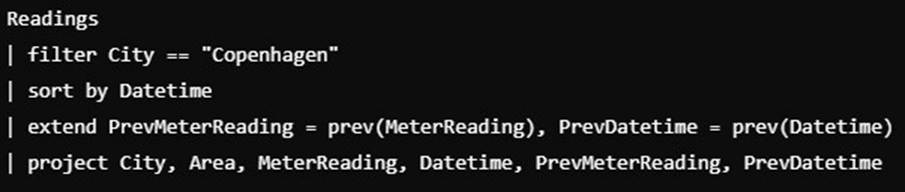
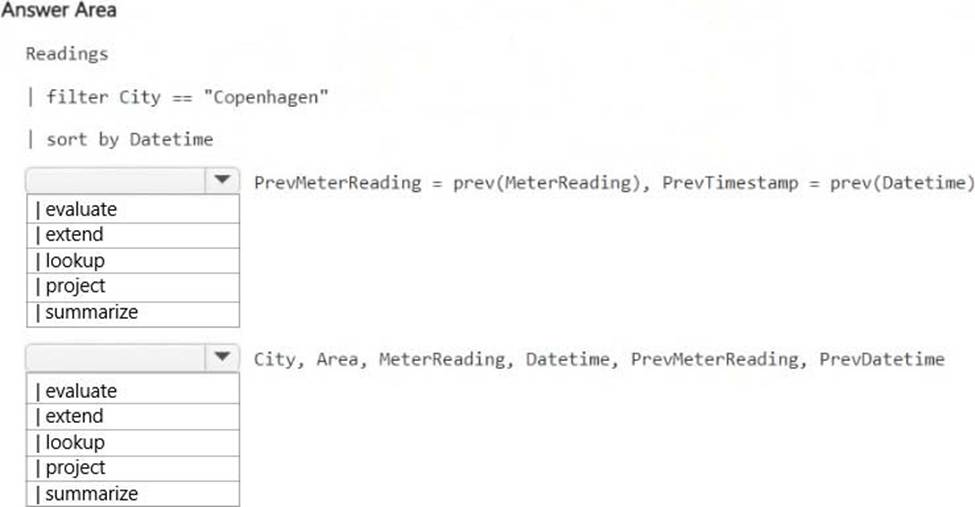
| extend
The prev() function retrieves the previous row’s value based on the sorted order.
extend PrevMeterReading = prev(MeterReading), PrevDatetime = prev(Datetime)
assigns these previous values.
| project
Used to select specific columns for the final result set. Ensures that City, Area, MeterReading, Datetime, PrevMeterReading, and PrevDatetime are included in the output.
HOTSPOT
You need to migrate the Research division data for Productline2. The solution must meet the data preparation requirements.
How should you complete the code? To answer, select the appropriate options in the answer area. NOTE: Each correct selection is worth one point.


Explanation:
Box 1: delta
Delta Lake uses versioned Parquet files to store your data in your cloud storage.
Box 2: Tables/productline2
Note: Apache Spark
Apache Spark notebooks and Apache Spark jobs can use shortcuts that you create in OneLake. Relative file paths can be used to directly read data from shortcuts. Additionally, if you create a shortcut in the Tables section of the lakehouse and it is in the Delta format, you can read it as a managed table using Apache Spark SQL syntax.
df = spark.read.format("delta").load("Tables/MyShortcut")
display(df)
df = spark.sql("SELECT * FROM MyLakehouse.MyShortcut LIMIT 1000")
display(df)
Scenario:
A Data Lake Storage Gen2 storage account named storage2 contains Research division data for a product line named Productline2. The data is in the CSV format.
Requirements, Planned Changes
For the Research division, create two Fabric workspaces named Productline1ws and Productline2ws.
Data Preparation Requirements
Contoso identifies the following data preparation requirements:
* The Research division data for Productline1 must be retrieved from Lakehouse1 by using Fabric notebooks.
*-> All the Research division data in the lakehouses must be presented as managed tables in Lakehouse explorer.
Note:
Spark provides two types of tables that Azure Synapse exposes in SQL automatically:
* Managed tables
Spark provides many options for how to store data in managed tables, such as TEXT, CSV, JSON, JDBC, PARQUET, ORC, HIVE, DELTA, and LIBSVM. These files are normally stored in the warehouse directory where managed table data is stored.
* External tables
Reference:
https://learn.microsoft.com/en-us/azure/synapse-analytics/metadata/table
https://learn.microsoft.com/en-us/fabric/onelake/onelake-shortcuts
HOTSPOT
You have a Fabric tenant that contains a warehouse named Warehouse1. Warehouse1 contains three schemas named schemaA, schemaB, and schemaC.
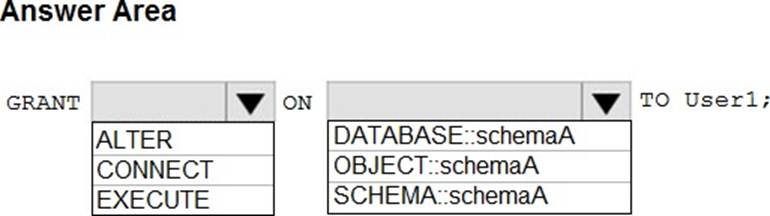
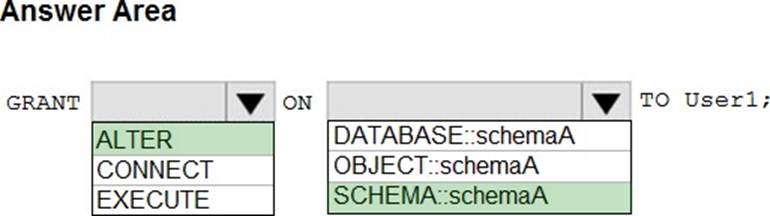
You need to ensure that a user named User1 can truncate tables in schemaA only.
How should you complete the T-SQL statement? To answer, select the appropriate options in the answer area. NOTE: Each correct selection is worth one point.
Explanation:
Box 1: ALTER
The minimum permission required is ALTER on table_name. TRUNCATE TABLE permissions default to the table owner, members of the sysadmin fixed server role, and the db_owner and db_ddladmin fixed database roles, and are not transferable.
Using DCL:
GRANT ALTER on schema::schemaname to ‘Azure User’
Box 2: SCHEMA::schemaA
Reference: https://learn.microsoft.com/en-us/sql/t-sql/statements/truncate-table-transact-sql
https://learn.microsoft.com/en-us/answers/questions/757108/truncate-table-permission-in-azure-synapse
You have a Fabric tenant that contains a complex semantic model. The model is based on a star schema and contains many tables, including a fact table named Sales.
You need to visualize a diagram of the model. The diagram must contain only the Sales table and related tables.
What should you use from Microsoft Power BI Desktop?
- A . data categories
- B . Data view
- C . Model view
- D . DAX query view
C
Explanation:
The Model view in Microsoft Power BI Desktop provides a visual representation of the relationships between tables in your semantic model. It allows you to see the structure of your star schema, including the Sales fact table and its related dimension tables. You can filter or focus on specific tables (like the Sales table and its related tables) to create a simplified view.
You have a Fabric tenant that contains a semantic model named Model1. Model1 uses Import mode.
Model1 contains a table named Orders.
Orders has 100 million rows and the following fields.
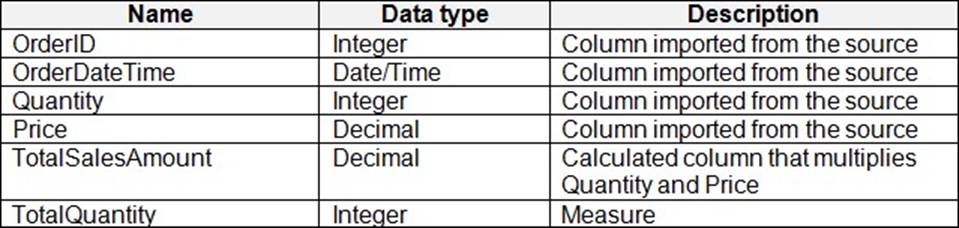
You need to reduce the memory used by Model1 and the time it takes to refresh the model.
Which two actions should you perform? Each correct answer presents part of the solution. NOTE: Each correct answer is worth one point.
- A . Split OrderDateTime into separate date and time columns.
- B . Replace TotalQuantity with a calculated column.
- C . Convert Quantity into the Text data type.
- D . Replace TotalSalesAmount with a measure.
You are analyzing the data in a Fabric notebook.
You have a Spark DataFrame assigned to a variable named df.
You need to use the Chart view in the notebook to explore the data manually.
Which function should you run to make the data available in the Chart view?
- A . displayHTML
- B . show
- C . write
- D . display
D
Explanation:
Built-in visualization command – display() function
The Fabric built-in visualization function allows you to turn Apache Spark DataFrames, Pandas DataFrames and SQL query results into rich format data visualizations.
You can use the display function on dataframes that created in PySpark and Scala on Spark DataFrames or Resilient Distributed Datasets (RDD) functions to produce the rich dataframe table view and chart view.
The output of SQL statement appears in the rendered table view by default.
Reference: https://learn.microsoft.com/en-us/fabric/data-engineering/notebook-visualization