
Microsoft DP-600 Practice Exams
Last updated on Oct 02,2026- Exam Code: DP-600
- Exam Name: Implementing Analytics Solutions Using Microsoft Fabric
- Certification Provider: Microsoft
- Latest update: Oct 02,2026
You have a Fabric tenant that contains a lakehouse named Lakehouse1. Lakehouse1 contains a Delta table that has one million Parquet files.
You need to remove files that were NOT referenced by the table during the past 30 days. The solution must ensure that the transaction log remains consistent, and the ACID properties of the table are maintained.
What should you do?
- A . From OneLake file explorer, delete the files.
- B . Run the OPTIMIZE command and specify the Z-order parameter.
- C . Run the OPTIMIZE command and specify the V-order parameter.
- D . Run the VACUUM command.
D
Explanation:
VACUUM
Applies to: check marked yes Databricks SQL check marked yes Databricks Runtime Remove unused files from a table directory.
VACUUM removes all files from the table directory that are not managed by Delta, as well as data files that are no longer in the latest state of the transaction log for the table and are older than a retention threshold.
Incorrect:
Not B: What is Z order optimization?
Z-ordering is a technique to colocate related information in the same set of files. This co-locality is
automatically used by Delta Lake on Azure Databricks data-skipping algorithms. This behavior dramatically
reduces the amount of data that Delta Lake on Azure Databricks needs to read.
Not C: Delta Lake table optimization and V-Order
V-Order is a write time optimization to the parquet file format that enables lightning-fast reads under the
Microsoft Fabric compute engines, such as Power BI, SQL, Spark, and others.
Power BI and SQL engines make use of Microsoft Verti-Scan technology and V-Ordered parquet files to achieve in-memory like data access times. Spark and other non-Verti-Scan compute engines also benefit from the V-Ordered files with an average of 10% faster read times, with some scenarios up to 50%.
V-Order works by applying special sorting, row group distribution, dictionary encoding and compression on parquet files, thus requiring less network, disk, and CPU resources in compute engines to read it, providing cost efficiency and performance. V-Order sorting has a 15% impact on average write times but provides up to 50% more compression.
Reference:
https://docs.databricks.com/en/sql/language-manual/delta-vacuum.html
https://learn.microsoft.com/en-us/fabric/data-engineering/delta-optimization-and-v-order?
You have a Fabric tenant that contains a Microsoft Power BI report.
You are exploring a new semantic model.
You need to display the following column statistics:
– Count
– Average
– Null count
– Distinct count
– Standard deviation
Which Power Query function should you run?
- A . Table.schema
- B . Table.view
- C . Table.FuzzyGroup
- D . Table.Profile
D
Explanation:
Power Query M, Table.Profile
Syntax
Table.Profile(table as table, optional additionalAggregates as nullable list) as table About
Returns a profile for the columns in table.
The following information is returned for each column (when applicable):
minimum
maximum
average
standard deviation
count
null count
distinct count
Reference: https://learn.microsoft.com/en-us/powerquery-m/table-profile
You have a Fabric warehouse that contains a table named Staging.Sales. Staging.Sales contains the following columns.
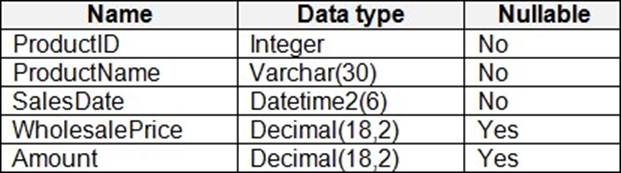
You need to write a T-SQL query that will return data for the year 2023 that displays ProductID and ProductName and has a summarized Amount that is higher than 10,000.
Which query should you use?
A)

B)

C)

D)

- A . Option A
- B . Option B
- C . Option C
- D . Option D
A
Explanation:
SELECT – GROUP BY- Transact-SQL
SELECT statement clause that divides the query result into groups of rows, usually by performing one or more aggregations on each group. The SELECT statement returns one row per group.
Note: General Remarks
How GROUP BY interacts with the SELECT statement
SELECT list:
Vector aggregates. If aggregate functions are included in the SELECT list, GROUP BY calculates a summary value for each group. These are known as vector aggregates.
Distinct aggregates. The aggregates AVG (DISTINCT column_name), COUNT (DISTINCT column_name), and SUM (DISTINCT column_name) are supported with ROLLUP, CUBE, and GROUPING SETS.
WHERE clause:
SQL removes Rows that do not meet the conditions in the WHERE clause before any grouping operation is performed.
*-> HAVING clause:
SQL uses the having clause to filter groups in the result set.
Incorrect:
Not B: Put the 2023 filtering in the WHERE clause, not in the HAVING clause.
Not C: Need a GROUP BY clause-
Not D: Can’t use the alias TOTALAMOUNT in the HAVING clause.
Reference: https://learn.microsoft.com/en-us/sql/t-sql/queries/select-group-by-transact-sql
Note: This section contains one or more sets of questions with the same scenario and problem. Each question presents a unique solution to the problem. You must determine whether the solution meets the stated goals. More than one solution in the set might solve the problem. It is also possible that none of the solutions in the set solve the problem.
After you answer a question in this section, you will NOT be able to return. As a result, these questions do not appear on the Review Screen.
Your network contains an on-premises Active Directory Domain Services (AD DS) domain named contoso.com that syncs with a Microsoft Entra tenant by using Microsoft Entra Connect.
You have a Fabric tenant that contains a semantic model.
You enable dynamic row-level security (RLS) for the model and deploy the model to the Fabric service.
You query a measure that includes the USERNAME() function, and the query returns a blank result.
You need to ensure that the measure returns the user principal name (UPN) of a user.
Solution: You update the measure to use the USERPRINCIPALNAME() function.
Does this meet the goal?
- A . Yes
- B . No
A
Explanation:
The USERPRINCIPALNAME () function directly retrieves the UPN of the user querying the measure. This is the most appropriate function to use if your goal is to obtain the UPN, which is the format typically used in environments that integrate with Microsoft Entra.
You need to refresh the Orders table of the Online Sales department. The solution must meet the semantic model requirements.
What should you include in the solution?
- A . an Azure Data Factory pipeline that executes a Stored procedure activity to retrieve the maximum value of the OrderID column in the destination lakehouse
- B . an Azure Data Factory pipeline that executes a Stored procedure activity to retrieve the minimum value of the OrderID column in the destination lakehouse
- C . an Azure Data Factory pipeline that executes a dataflow to retrieve the minimum value of the OrderID
column in the destination lakehouse - D . an Azure Data Factory pipeline that executes a dataflow to retrieve the maximum value of the OrderID column in the destination lakehouse
D
Explanation:
Dataflow instead of Store procedure to minimize implementation and maintenance effort. Maximum OrderID top retrieve the Order that was created most recently.
Scenario:
The semantic model of the Online Sales department includes a fact table named Orders that uses Import made. In the system of origin, the OrderID value represents the sequence in which orders are created.
Semantic Model Requirements
Contoso identifies the following requirements for implementing and managing semantic models:
*-> The number of rows added to the Orders table during refreshes must be minimized.
The semantic models in the Research division workspaces must use Direct Lake mode.
General Requirements
Contoso identifies the following high-level requirements that must be considered for all solutions:
Follow the principle of least privilege when applicable.
*-> Minimize implementation and maintenance effort when possible.
HOTSPOT
You have a Microsoft Power BI project that contains a file named definition.pbir. definition.pbir contains the following JSON.
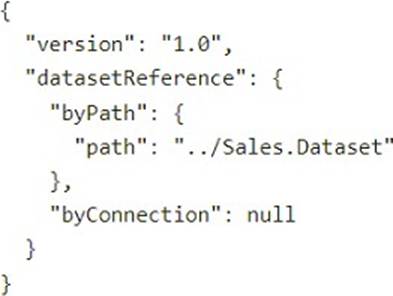
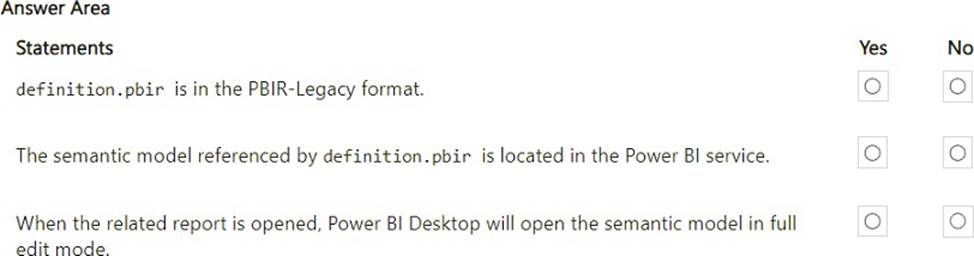
For each of the following statements, select Yes if the statement is true. Otherwise, select No. NOTE: Each correct selection is worth one point. Hot Area:
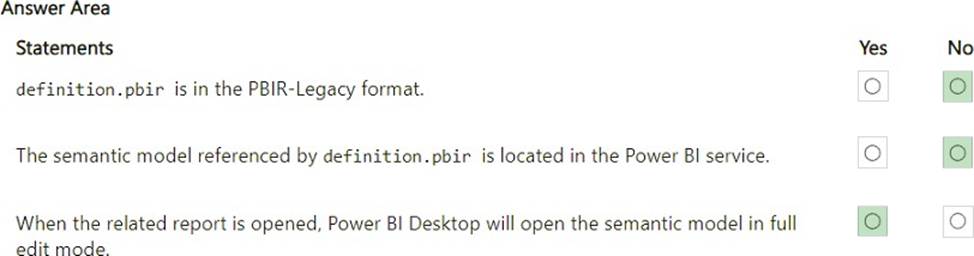
Explanation:
definition.pbir is in the PBIR-Legacy format – No
The JSON structure indicates a dataset reference (datasetReference), which aligns with the newer PBIR format. The PBIR-Legacy format uses a different structure that does not include these specific fields.
The semantic model referenced by definition.pbir is located in the Power BI service – No
The byPath property in the JSON refers to a local file path (../Sales.Dataset). This indicates that the semantic model is not stored in the Power BI service but is instead referenced locally.
When the related report is opened, Power BI Desktop will open the semantic model in full edit mode – Yes
Since the semantic model is referenced by a local file path (byPath), Power BI Desktop can load the model in full edit mode, allowing modifications.
The PBIR format is used to store definitions for Power BI reports. The format can refer to datasets locally (byPath) or in the Power BI service (byConnection). In this case, the byPath property indicates a local reference, which impacts how the report and dataset are opened and used in Power BI Desktop.
You have a Microsoft Power BI semantic model.
You need to identify any surrogate key columns in the model that have the Summarize By property set to a value other than to None. The solution must minimize effort.
What should you use?
- A . DAX Formatter in DAX Studio
- B . Model explorer in Microsoft Power BI Desktop
- C . Model view in Microsoft Power BI Desktop
- D . Best Practice Analyzer in Tabular Editor
D
Explanation:
BPA lets you define rules on the metadata of your model, to encourage certain conventions and best practices while developing in SSAS Tabular.
Clicking one of the rules in the top list, will show you all objects that satisfy the conditions of the given rule in the bottom list:
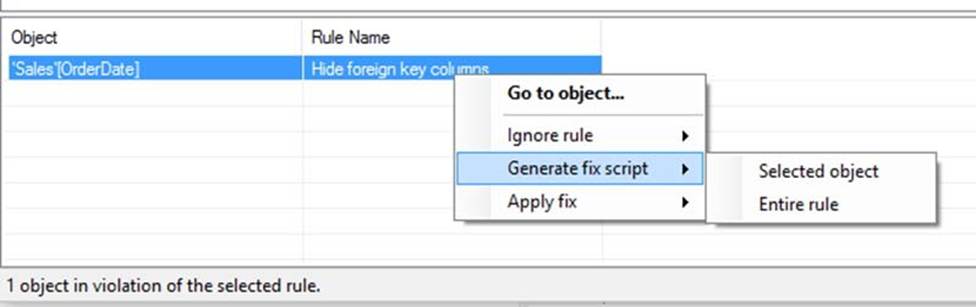
Note: The Best Practice Analyzer (BPA) lets you define rules on the metadata of your model, to encourage certain conventions and best practices while developing your Power BI or Analysis Services Model.
PBA Overview
The BPA overview shows you all the rules defined in your model that are currently being broken:
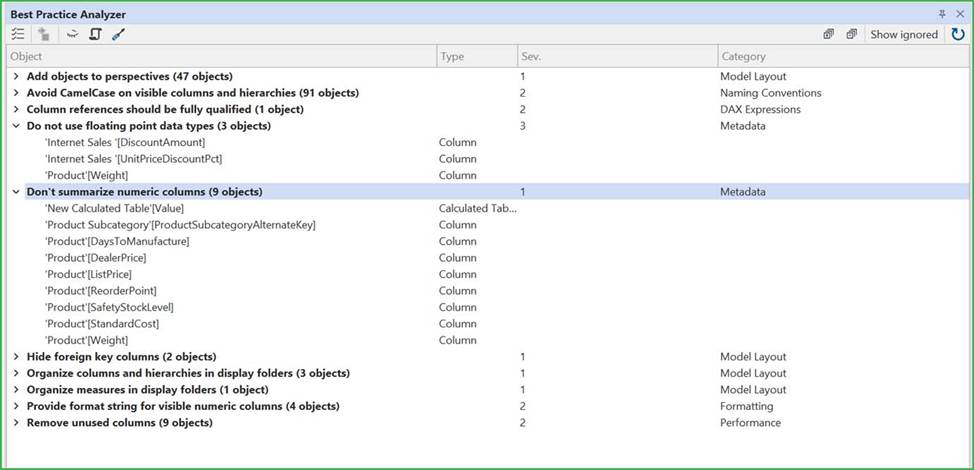
Incorrect:
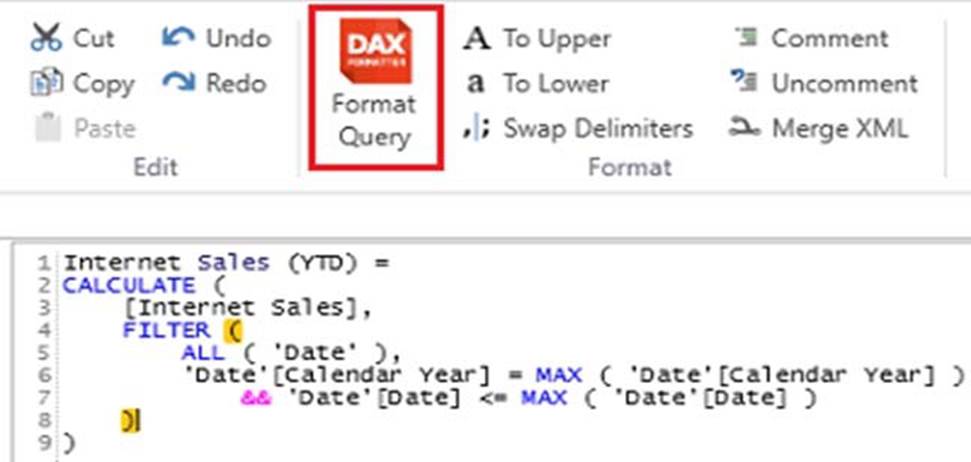
* DAX Formatter in DAX Studio
DAX Formatter can be used within DAX Studio to align parentheses with their associated functions.
* Model explorer in Microsoft Power BI Desktop
With Model explorer in the Model view in Power BI, you can view and work with complex semantic models with many tables, relationships, measures, roles, calculation groups, translations, and perspectives.
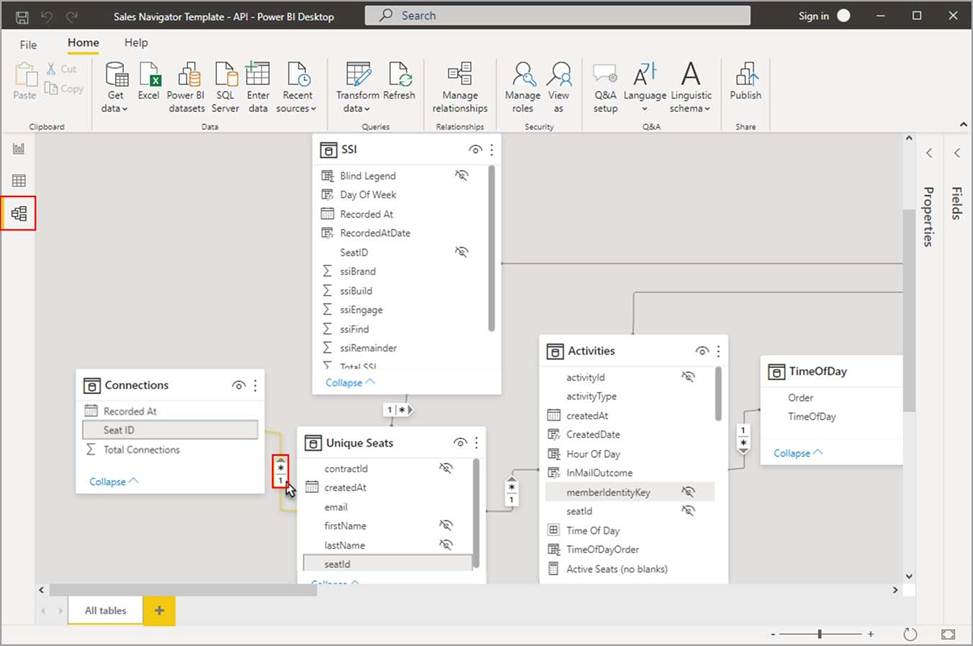
* Model view in Microsoft Power BI Desktop
Model view shows all of the tables, columns, and relationships in your model. This view can be especially helpful when your model has complex relationships between many tables.
Reference:
https://docs.tabulareditor.com/te2/Best-Practice-Analyzer.html
https://docs.tabulareditor.com/common/using-bpa.html?tabs=TE3Rules
https://learn.microsoft.com/en-us/power-bi/transform-model/model-explorer
You have a Fabric workspace named Workspace1 that contains a dataflow named Dataflow1. Dataflow1 has a query that returns 2,000 rows.
You view the query in Power Query as shown in the following exhibit.
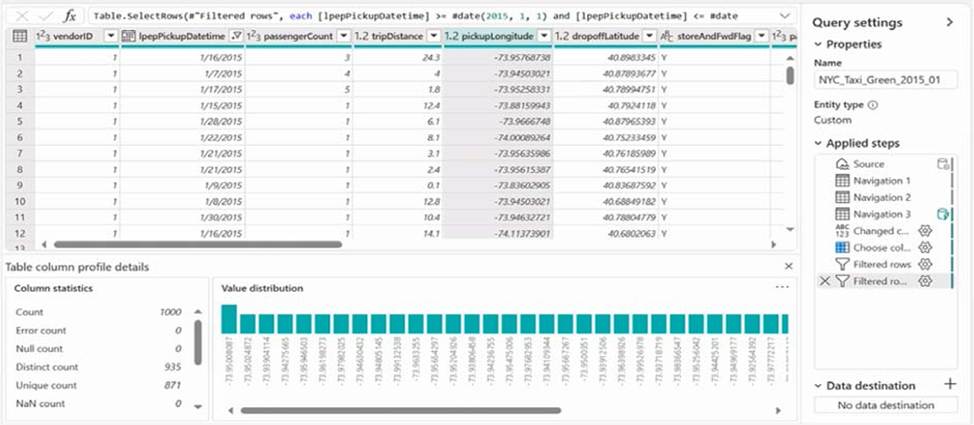
What can you identify about the pickupLongitude column?
- A . The column has duplicate values.
- B . All the table rows are profiled.
- C . The column has missing values.
- D . There are 935 values that occur only once.
A
Explanation:
Count is 1000.
Distinct count is 935.
There are duplicate values.
Note: The Count Distinct aggregate function in Power BI is useful for counting the number of unique values in a column of a dataset. It provides fast, accurate, and efficient results when you need to calculate the number of unique items in a data set, such as the number of unique customers, products, or transactions.
Incorrect:
Not B: Null count is 0.
Not D: Unique count is 871.
Reference: https://www.onlc.com/blog/what-is-count-distinct-in-power-bi
You have a Fabric workspace named Workspace1 that contains a dataflow named Dataflow1. Dataflow1 has a query that returns 2,000 rows.
You view the query in Power Query as shown in the following exhibit.
What can you identify about the pickupLongitude column?
- A . The column has duplicate values.
- B . All the table rows are profiled.
- C . The column has missing values.
- D . There are 935 values that occur only once.
A
Explanation:
Count is 1000.
Distinct count is 935.
There are duplicate values.
Note: The Count Distinct aggregate function in Power BI is useful for counting the number of unique values in a column of a dataset. It provides fast, accurate, and efficient results when you need to calculate the number of unique items in a data set, such as the number of unique customers, products, or transactions.
Incorrect:
Not B: Null count is 0.
Not D: Unique count is 871.
Reference: https://www.onlc.com/blog/what-is-count-distinct-in-power-bi
You have a Fabric tenant that contains a Microsoft Power BI report named Report1. Report1 includes a Python visual.
Data displayed by the visual is grouped automatically and duplicate rows are NOT displayed.
You need all rows to appear in the visual.
What should you do?
- A . Reference the columns in the Python code by index.
- B . Modify the Sort Column By property for all columns.
- C . Add a unique field to each row.
- D . Modify the Summarize By property for all columns.