
Microsoft DP-600 Practice Exams
Last updated on Oct 02,2026- Exam Code: DP-600
- Exam Name: Implementing Analytics Solutions Using Microsoft Fabric
- Certification Provider: Microsoft
- Latest update: Oct 02,2026
HOTSPOT
You have a Fabric tenant that contains a lakehouse.
You are using a Fabric notebook to save a large DataFrame by using the following code.
df.write.partitionBy(“year”, “month”, “day”).mode(“overwrite”).parquet(“Files/ SalesOrder”)
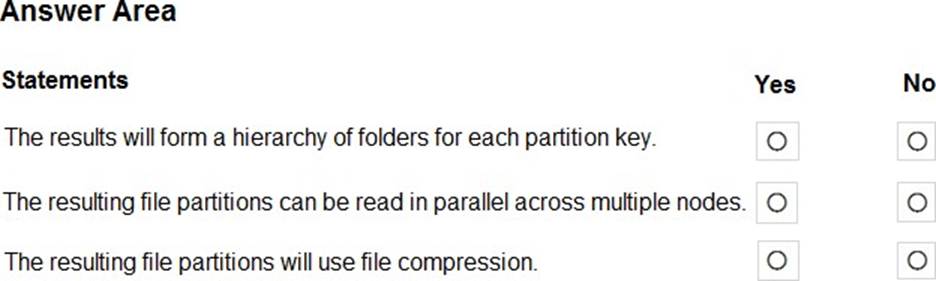
For each of the following statements, select Yes if the statement is true. Otherwise, select No. NOTE: Each correct selection is worth one point. Hot Area:
Explanation:
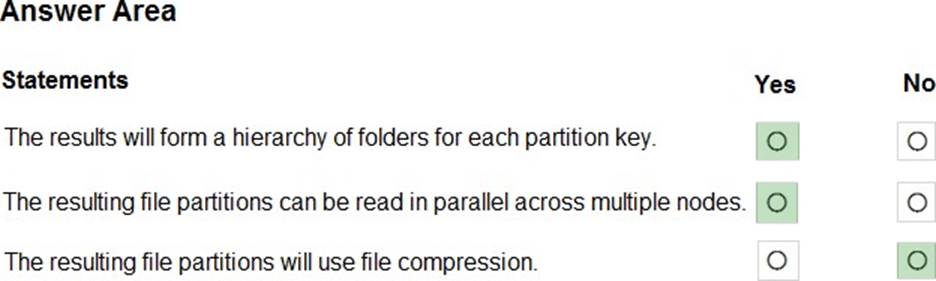
Box 1: Yes
PartitionBy segregates data into folders.
Note: PySpark partitionBy() is a function of pyspark.sql.DataFrameWriter class which is used to partition the large dataset (DataFrame) into smaller files based on one or multiple columns while writing to disk-
Box 2: Yes
Box 3: No
Reference: https://sparkbyexamples.com/pyspark/pyspark-partitionby-example/
Which type of data store should you recommend in the AnalyticsPOC workspace?
- A . a data lake
- B . a warehouse
- C . a lakehouse
- D . an external Hive metastore
C
Explanation:
Within the Data Lakehouse:
You can store unstructured, semi-structured, or structured data.
The data is organized by folders and files, lake databases, and delta tables.
Scenario:
All the semantic models and reports in the Analytics POC workspace will use the data store as the sole data source.
Technical Requirements
The data store must support the following:
Read access by using T-SQL or Python
*-> Semi-structured and unstructured data
Row-level security (RLS) for users executing T-SQL queries
Incorrect:
Not A: a data lake
A data lake would be the data source of the lakehouse.
Not B: a warehouse
Within the Data Warehouse:
*-> You can store structured data.
The data is organized by databases, schemas, and tables (delta tables behind the scenes)
Reference: https://blog.fabric.microsoft.com/en-US/blog/lakehouse-vs-data-warehouse-deep-dive-into-use-cases-
differences-and-architecture-designs/
HOTSPOT
You have a Fabric workspace that contains a warehouse named Warehouse1. Warehouse1 contains the following data.
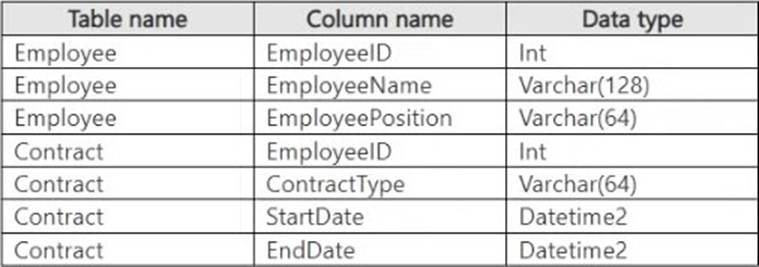
You need to create a T-SQL statement that will denormalize the tables and include the ContractType and
StartDate attributes in the results.
The solution must meet the following requirements:
– Include attributes from matching rows in the Contract table.
– Ensure that all the rows from the Employee table are preserved.
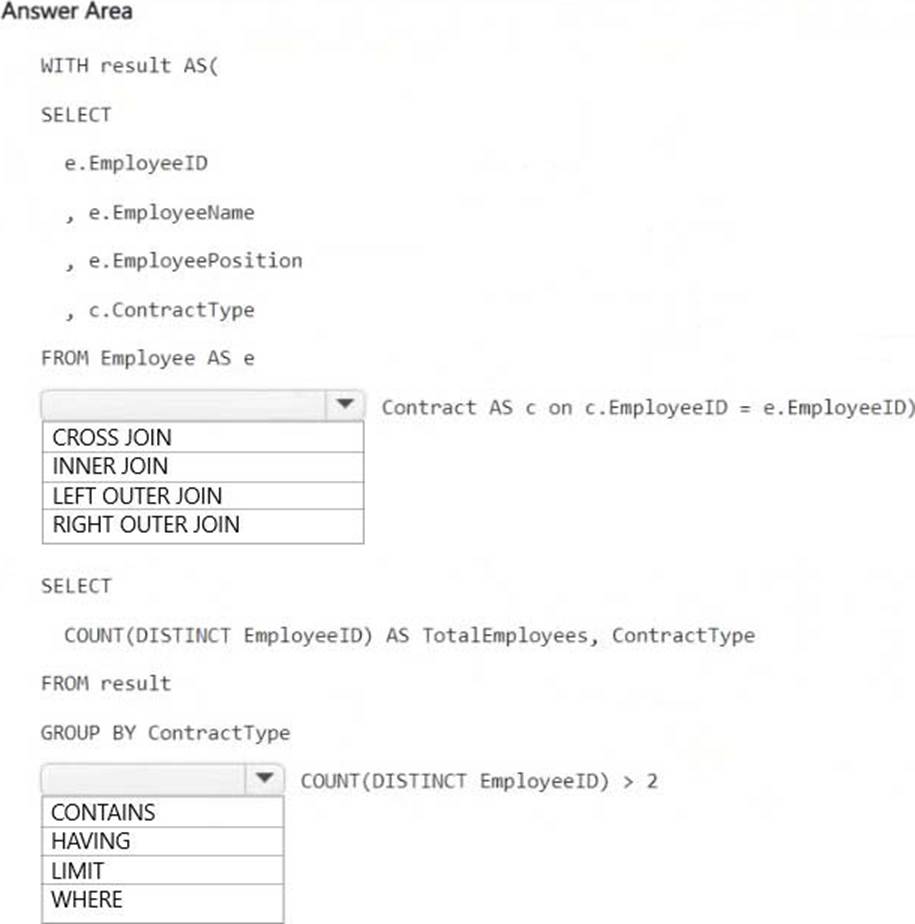
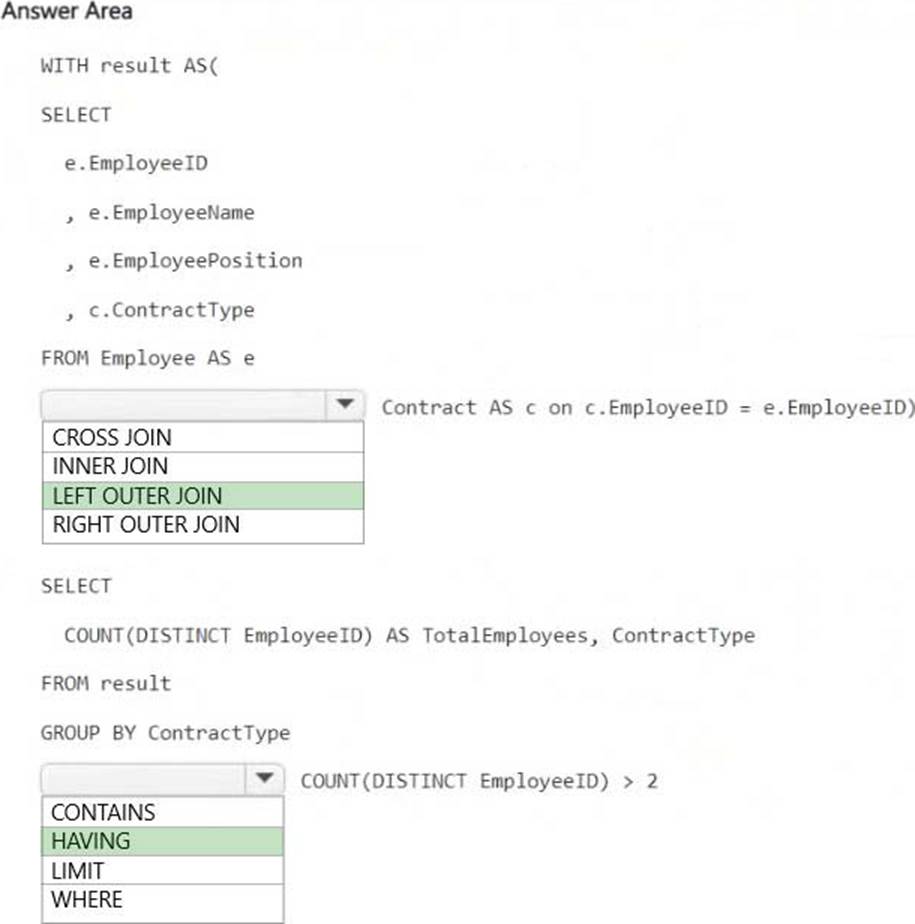
– Return the total number of employees per contract type for all the contract types that have more than two employees.
How should you complete the statement? To answer, select the appropriate options in the answer area. NOTE: Each correct selection is worth one point.
Explanation:
LEFT OUTER JOIN
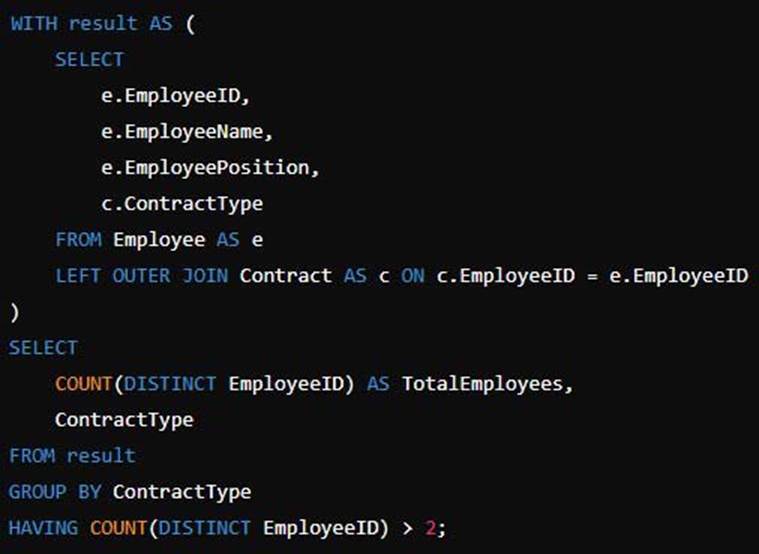
Ensures that all employees are included even if they do not have a matching contract record in the Contract table. This satisfies the requirement that all Employee table rows must be preserved.
HAVING COUNT(DISTINCT EmployeeID) > 2
Filters out contract types that have fewer than or equal to two employees, ensuring that only contract types with more than two employees are included in the results.
HOTSPOT
You have a Fabric workspace that contains a warehouse named Warehouse1. Warehouse1 contains the following data.
You need to create a T-SQL statement that will denormalize the tables and include the ContractType and
StartDate attributes in the results.
The solution must meet the following requirements:
– Include attributes from matching rows in the Contract table.
– Ensure that all the rows from the Employee table are preserved.
– Return the total number of employees per contract type for all the contract types that have more than two employees.
How should you complete the statement? To answer, select the appropriate options in the answer area. NOTE: Each correct selection is worth one point.
Explanation:
LEFT OUTER JOIN
Ensures that all employees are included even if they do not have a matching contract record in the Contract table. This satisfies the requirement that all Employee table rows must be preserved.
HAVING COUNT(DISTINCT EmployeeID) > 2
Filters out contract types that have fewer than or equal to two employees, ensuring that only contract types with more than two employees are included in the results.
You have a Fabric tenant that contains a semantic model. The model contains 15 tables.
You need to programmatically change each column that ends in the word Key to meet the following requirements:
– Hide the column.
– Set Nullable to False
– Set Summarize By to None.
– Set Available in MDX to False.
– Mark the column as a key column.
What should you use?
- A . Microsoft Power BI Desktop
- B . ALM Toolkit
- C . Tabular Editor
- D . DAX Studio
C
Explanation:
Tabular Editor can be a helpful tool for managing datasets deployed to Fabric. With Tabular Editor, you can connect to and manage different types of datasets from a single interface. This is ideal for supporting and auditing data models, such as in a managed self-service BI environment.
Enhance productivity: Tabular Editor contains features that help you write DAX, manage your dataset and even automate and scale development, programmatically.
* Manage tables and columns: While most people use Tabular Editor to manage DAX, you can also manage data tables and columns. In Tabular Editor, you can view and edit Power Query code, and even automatically detect schema changes in the data source. With the Table Import Wizard, you can add new tables from supported sources like Power BI dataflows, SQL Server (or Serverless Pools) and Databricks, as Tabular Editor automatically generates the appropriate Power Query code and metadata for you. Finally, you can refresh selected tables to view any changes, with the ability to track refresh performance in real-time or even cancel and pause refreshes with the user interface.
* Etc.
Incorrect:
Not B: ALM Toolkit is a free and open-source tool to manage Microsoft Power BI datasets: Database compare, Code merging, Easy deployment, Source-control integration, Reuse definitions, Self-service to corporate BI.
It is based on the source code of BISM Normalizer, which provides similar features for Tabular models.
Reference: https://blog.tabulareditor.com/2023/07/13/using-tabular-editor-in-microsoft-fabric
Prepare data
Testlet 2
Case study
This is a case study. Case studies are not timed separately. You can use as much exam time as you would like to complete each case. However, there may be additional case studies and sections on this exam. You must manage your time to ensure that you are able to complete all questions included on this exam in the time provided.
To answer the questions included in a case study, you will need to reference information that is provided in the case study. Case studies might contain exhibits and other resources that provide more information about the scenario that is described in the case study. Each question is independent of the other questions in this case study.
At the end of this case study, a review screen will appear. This screen allows you to review your answers and to make changes before you move to the next section of the exam. After you begin a new section, you cannot return to this section.
To start the case study
To display the first question in this case study, click the Next button. Use the buttons in the left pane to explore the content of the case study before you answer the questions. Clicking these buttons displays information such as business requirements, existing environment, and problem statements. If the case study has an All Information tab, note that the information displayed is identical to the information displayed on the subsequent tabs. When you are ready to answer a question, click the Question button to return to the question.
Overview
Litware, Inc. is a manufacturing company that has offices throughout North America. The analytics team at Litware contains data engineers, analytics engineers, data analysts, and data scientists.
Existing Environment
Fabric Environment
Litware has been using a Microsoft Power BI tenant for three years. Litware has NOT enabled any Fabric capacities and features.
Available Data
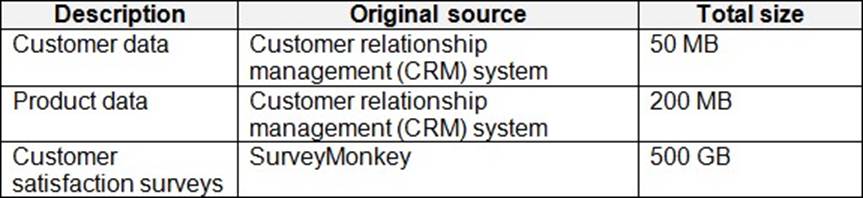
Litware has data that must be analyzed as shown in the following table.
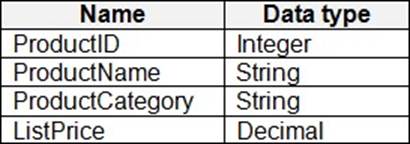
The Product data contains a single table and the following columns.
The customer satisfaction data contains the following tables:
– Survey
– Question
– Response
For each survey submitted, the following occurs:
– One row is added to the Survey table.
– One row is added to the Response table for each question in the survey.
The Question table contains the text of each survey question. The third question in each survey response is an overall satisfaction score. Customers can submit a survey after each purchase.
User Problems
The analytics team has large volumes of data, some of which is semi-structured. The team wants to use Fabric to create a new data store.
Product data is often classified into three pricing groups: high, medium, and low. This logic is implemented in several databases and semantic models, but the logic does NOT always match across implementations.
Requirements
Planned Changes
Litware plans to enable Fabric features in the existing tenant. The analytics team will create a new data store as a proof of concept (PoC). The remaining Litware users will only get access to the Fabric features once the PoC is complete. The PoC will be completed by using a Fabric trial capacity.
The following three workspaces will be created:
– AnalyticsPOC: Will contain the data store, semantic models, reports pipelines, dataflow, and notebooks used to populate the data store
– DataEngPOC: Will contain all the pipelines, dataflows, and notebooks used to populate OneLake
– DataSciPOC: Will contain all the notebooks and reports created by the data scientists
The following will be created in the AnalyticsPOC workspace:
– A data store (type to be decided)
– A custom semantic model
– A default semantic model
– Interactive reports
The data engineers will create data pipelines to load data to OneLake either hourly or daily depending on the data source. The analytics engineers will create processes to ingest, transform, and load the data to the data store in the AnalyticsPOC workspace daily. Whenever possible, the data engineers will use low-code tools for data ingestion. The choice of which data cleansing and transformation tools to use will be at the data engineers’ discretion.
All the semantic models and reports in the Analytics POC workspace will use the data store as the sole data source.
Technical Requirements
The data store must support the following:
– Read access by using T-SQL or Python
– Semi-structured and unstructured data
– Row-level security (RLS) for users executing T-SQL queries
Files loaded by the data engineers to OneLake will be stored in the Parquet format and will meet Delta Lake specifications.
Data will be loaded without transformation in one area of the AnalyticsPOC data store. The data will then be cleansed, merged, and transformed into a dimensional model.
The data load process must ensure that the raw and cleansed data is updated completely before populating the dimensional model.
The dimensional model must contain a date dimension. There is no existing data source for the date dimension. The Litware fiscal year matches the calendar year. The date dimension must always contain dates from 2010 through the end of the current year.
The product pricing group logic must be maintained by the analytics engineers in a single location. The pricing group data must be made available in the data store for T-SQL queries and in the default semantic model.
The following logic must be used:
– List prices that are less than or equal to 50 are in the low pricing group.
– List prices that are greater than 50 and less than or equal to 1,000 are in the medium pricing group.
– List prices that are greater than 1,000 are in the high pricing group.
Security Requirements
Only Fabric administrators and the analytics team must be able to see the Fabric items created as part of the PoC.
Litware identifies the following security requirements for the Fabric items in the AnalyticsPOC workspace:
– Fabric administrators will be the workspace administrators.
– The data engineers must be able to read from and write to the data store. No access must be granted to datasets or reports.
– The analytics engineers must be able to read from, write to, and create schemas in the data store. They also must be able to create and share semantic models with the data analysts and view and modify all reports in the workspace.
– The data scientists must be able to read from the data store, but not write to it. They will access the data by using a Spark notebook
– The data analysts must have read access to only the dimensional model objects in the data store. They also must have access to create Power BI reports by using the semantic models created by the analytics engineers.
– The date dimension must be available to all users of the data store.
– The principle of least privilege must be followed.
Both the default and custom semantic models must include only tables or views from the dimensional model in the data store.
Litware already has the following Microsoft Entra security groups:
– FabricAdmins: Fabric administrators
– AnalyticsTeam: All the members of the analytics team
– DataAnalysts: The data analysts on the analytics team
– DataScientists: The data scientists on the analytics team
– DataEngineers: The data engineers on the analytics team
– AnalyticsEngineers: The analytics engineers on the analytics team
Report Requirements
The data analysts must create a customer satisfaction report that meets the following requirements:
– Enables a user to select a product to filter customer survey responses to only those who have purchased that product.
– Displays the average overall satisfaction score of all the surveys submitted during the last 12 months up to a selected date.
– Shows data as soon as the data is updated in the data store.
– Ensures that the report and the semantic model only contain data from the current and previous year.
– Ensures that the report respects any table-level security specified in the source data store.
– Minimizes the execution time of report queries.
What should you recommend using to ingest the customer data into the data store in the AnalyticsPOC workspace?
- A . a stored procedure
- B . a pipeline that contains a KQL activity
- C . a Spark notebook
- D . a dataflow
D
Explanation:
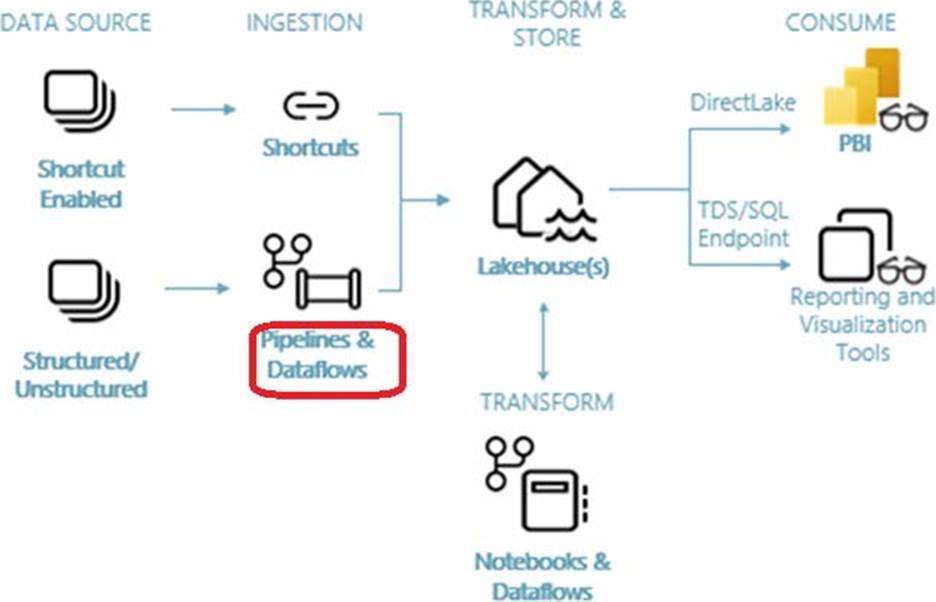
Lakehouse end-to-end scenario: overview and architecture Architecture
The following image shows the lakehouse end-to-end architecture. The components involved are described in the following list.
Scenario:
The data engineers will create data pipelines to load data to OneLake either hourly or daily depending on the data source. The analytics engineers will create processes to ingest, transform, and load the data to the data store in the AnalyticsPOC workspace daily. Whenever possible, the data engineers will use low-code tools for data ingestion. The choice of which data cleansing and transformation tools to use will be at the data engineers’ discretion.
* Ingestion: You can quickly build insights for your organization using more than 200 native connectors. These connectors are integrated into the Fabric pipeline and utilize the user-friendly drag-and-drop data transformation with *dataflow*.
* Transform and store: Fabric standardizes on Delta Lake format.
Which means all the Fabric engines can access and manipulate the same dataset stored in OneLake without duplicating data. This storage system provides the flexibility to build lakehouses using a medallion architecture or a data mesh, depending on your organizational requirement. You can choose between a low-code or no-code experience for data transformation, utilizing either *pipelines/dataflows* or notebook/Spark for a code-first experience.
Incorrect:
* stored procedure, a Spark notebook Would require coding.
Reference: https://learn.microsoft.com/en-us/fabric/data-engineering/tutorial-lakehouse-introduction
Prepare data
Testlet 2
Case study
This is a case study. Case studies are not timed separately. You can use as much exam time as you would like to complete each case. However, there may be additional case studies and sections on this exam. You must manage your time to ensure that you are able to complete all questions included on this exam in the time provided.
To answer the questions included in a case study, you will need to reference information that is provided in the case study. Case studies might contain exhibits and other resources that provide more information about the scenario that is described in the case study. Each question is independent of the other questions in this case study.
At the end of this case study, a review screen will appear. This screen allows you to review your answers and to make changes before you move to the next section of the exam. After you begin a new section, you cannot return to this section.
To start the case study
To display the first question in this case study, click the Next button. Use the buttons in the left pane to explore the content of the case study before you answer the questions. Clicking these buttons displays information such as business requirements, existing environment, and problem statements. If the case study has an All Information tab, note that the information displayed is identical to the information displayed on the subsequent tabs. When you are ready to answer a question, click the Question button to return to the question.
Overview
Litware, Inc. is a manufacturing company that has offices throughout North America. The analytics team at Litware contains data engineers, analytics engineers, data analysts, and data scientists.
Existing Environment
Fabric Environment
Litware has been using a Microsoft Power BI tenant for three years. Litware has NOT enabled any Fabric capacities and features.
Available Data
Litware has data that must be analyzed as shown in the following table.
The Product data contains a single table and the following columns.
The customer satisfaction data contains the following tables:
– Survey
– Question
– Response
For each survey submitted, the following occurs:
– One row is added to the Survey table.
– One row is added to the Response table for each question in the survey.
The Question table contains the text of each survey question. The third question in each survey response is an overall satisfaction score. Customers can submit a survey after each purchase.
User Problems
The analytics team has large volumes of data, some of which is semi-structured. The team wants to use Fabric to create a new data store.
Product data is often classified into three pricing groups: high, medium, and low. This logic is implemented in several databases and semantic models, but the logic does NOT always match across implementations.
Requirements
Planned Changes
Litware plans to enable Fabric features in the existing tenant. The analytics team will create a new data store as a proof of concept (PoC). The remaining Litware users will only get access to the Fabric features once the PoC is complete. The PoC will be completed by using a Fabric trial capacity.
The following three workspaces will be created:
– AnalyticsPOC: Will contain the data store, semantic models, reports pipelines, dataflow, and notebooks used to populate the data store
– DataEngPOC: Will contain all the pipelines, dataflows, and notebooks used to populate OneLake
– DataSciPOC: Will contain all the notebooks and reports created by the data scientists
The following will be created in the AnalyticsPOC workspace:
– A data store (type to be decided)
– A custom semantic model
– A default semantic model
– Interactive reports
The data engineers will create data pipelines to load data to OneLake either hourly or daily depending on the data source. The analytics engineers will create processes to ingest, transform, and load the data to the data store in the AnalyticsPOC workspace daily. Whenever possible, the data engineers will use low-code tools for data ingestion. The choice of which data cleansing and transformation tools to use will be at the data engineers’ discretion.
All the semantic models and reports in the Analytics POC workspace will use the data store as the sole data source.
Technical Requirements
The data store must support the following:
– Read access by using T-SQL or Python
– Semi-structured and unstructured data
– Row-level security (RLS) for users executing T-SQL queries
Files loaded by the data engineers to OneLake will be stored in the Parquet format and will meet Delta Lake specifications.
Data will be loaded without transformation in one area of the AnalyticsPOC data store. The data will then be cleansed, merged, and transformed into a dimensional model.
The data load process must ensure that the raw and cleansed data is updated completely before populating the dimensional model.
The dimensional model must contain a date dimension. There is no existing data source for the date dimension. The Litware fiscal year matches the calendar year. The date dimension must always contain dates from 2010 through the end of the current year.
The product pricing group logic must be maintained by the analytics engineers in a single location. The pricing group data must be made available in the data store for T-SQL queries and in the default semantic model.
The following logic must be used:
– List prices that are less than or equal to 50 are in the low pricing group.
– List prices that are greater than 50 and less than or equal to 1,000 are in the medium pricing group.
– List prices that are greater than 1,000 are in the high pricing group.
Security Requirements
Only Fabric administrators and the analytics team must be able to see the Fabric items created as part of the PoC.
Litware identifies the following security requirements for the Fabric items in the AnalyticsPOC workspace:
– Fabric administrators will be the workspace administrators.
– The data engineers must be able to read from and write to the data store. No access must be granted to datasets or reports.
– The analytics engineers must be able to read from, write to, and create schemas in the data store. They also must be able to create and share semantic models with the data analysts and view and modify all reports in the workspace.
– The data scientists must be able to read from the data store, but not write to it. They will access the data by using a Spark notebook
– The data analysts must have read access to only the dimensional model objects in the data store. They also must have access to create Power BI reports by using the semantic models created by the analytics engineers.
– The date dimension must be available to all users of the data store.
– The principle of least privilege must be followed.
Both the default and custom semantic models must include only tables or views from the dimensional model in the data store.
Litware already has the following Microsoft Entra security groups:
– FabricAdmins: Fabric administrators
– AnalyticsTeam: All the members of the analytics team
– DataAnalysts: The data analysts on the analytics team
– DataScientists: The data scientists on the analytics team
– DataEngineers: The data engineers on the analytics team
– AnalyticsEngineers: The analytics engineers on the analytics team
Report Requirements
The data analysts must create a customer satisfaction report that meets the following requirements:
– Enables a user to select a product to filter customer survey responses to only those who have purchased that product.
– Displays the average overall satisfaction score of all the surveys submitted during the last 12 months up to a selected date.
– Shows data as soon as the data is updated in the data store.
– Ensures that the report and the semantic model only contain data from the current and previous year.
– Ensures that the report respects any table-level security specified in the source data store.
– Minimizes the execution time of report queries.
What should you recommend using to ingest the customer data into the data store in the AnalyticsPOC workspace?
- A . a stored procedure
- B . a pipeline that contains a KQL activity
- C . a Spark notebook
- D . a dataflow
D
Explanation:
Lakehouse end-to-end scenario: overview and architecture Architecture
The following image shows the lakehouse end-to-end architecture. The components involved are described in the following list.
Scenario:
The data engineers will create data pipelines to load data to OneLake either hourly or daily depending on the data source. The analytics engineers will create processes to ingest, transform, and load the data to the data store in the AnalyticsPOC workspace daily. Whenever possible, the data engineers will use low-code tools for data ingestion. The choice of which data cleansing and transformation tools to use will be at the data engineers’ discretion.
* Ingestion: You can quickly build insights for your organization using more than 200 native connectors. These connectors are integrated into the Fabric pipeline and utilize the user-friendly drag-and-drop data transformation with *dataflow*.
* Transform and store: Fabric standardizes on Delta Lake format.
Which means all the Fabric engines can access and manipulate the same dataset stored in OneLake without duplicating data. This storage system provides the flexibility to build lakehouses using a medallion architecture or a data mesh, depending on your organizational requirement. You can choose between a low-code or no-code experience for data transformation, utilizing either *pipelines/dataflows* or notebook/Spark for a code-first experience.
Incorrect:
* stored procedure, a Spark notebook Would require coding.
Reference: https://learn.microsoft.com/en-us/fabric/data-engineering/tutorial-lakehouse-introduction
You have a Fabric workspace named Workspace1 that contains a dataflow named Dataflow1. Dataflow1 returns 500 rows of data.
You need to identify the min and max values for each column in the query results.
Which three Data view options should you select? Each correct answer presents part of the solution. NOTE: Each correct answer is worth one point.
- A . Show column value distribution
- B . Enable column profile
- C . Show column profile in details pane
- D . Show column quality details
- E . Enable details pane
You have a Fabric workspace named Workspace1 that contains a dataflow named Dataflow1. Dataflow1 returns 500 rows of data.
You need to identify the min and max values for each column in the query results.
Which three Data view options should you select? Each correct answer presents part of the solution. NOTE: Each correct answer is worth one point.
- A . Show column value distribution
- B . Enable column profile
- C . Show column profile in details pane
- D . Show column quality details
- E . Enable details pane
You have a Fabric tenant that contains a workspace named Workspace1. Workspace1 uses Pro license mode and contains a semantic model named Model1.
You need to ensure that Model1 supports XMLA connections.
Which setting should modify?
- A . Users can edit data models in the Power BI service
- B . Enforce strict access control for all data connection types
- C . Enable Cache for Shortcuts
- D . License mode
D
Explanation:
To enable XMLA connections for a semantic model in Power BI, the workspace containing the model must be set to Premium license mode. The XMLA endpoint is only supported in workspaces that are in Premium capacity or Premium Per User (PPU) license mode.
Since Workspace1 is currently in Pro license mode, you need to change the license mode to either Premium capacity or PPU to ensure Model1 supports XMLA connections.