
Adobe AD0-E608 Practice Exams
Last updated on Oct 22,2026- Exam Code: AD0-E608
- Exam Name: Adobe Customer Journey Analytics Business Practitioner Professional
- Certification Provider: Adobe
- Latest update: Oct 22,2026
Which setting should be configured first when creating a custom report in Adobe CJA?
- A . Date Range Filter
- B . Campaign Priority Level
- C . Calculated Metric Formula
- D . Data Export Rules
Which Adobe CJA features support audience segmentation in reporting? (Select two.)
- A . Profile-Based Filters
- B . Segment Overlap Tool
- C . Campaign Execution Module
- D . Custom Data Views
Which components should be used when creating calculated metrics in Adobe CJA? (Select two.)
- A . Metrics
- B . Dimensions
- C . Event Types
- D . Data Processing Rules
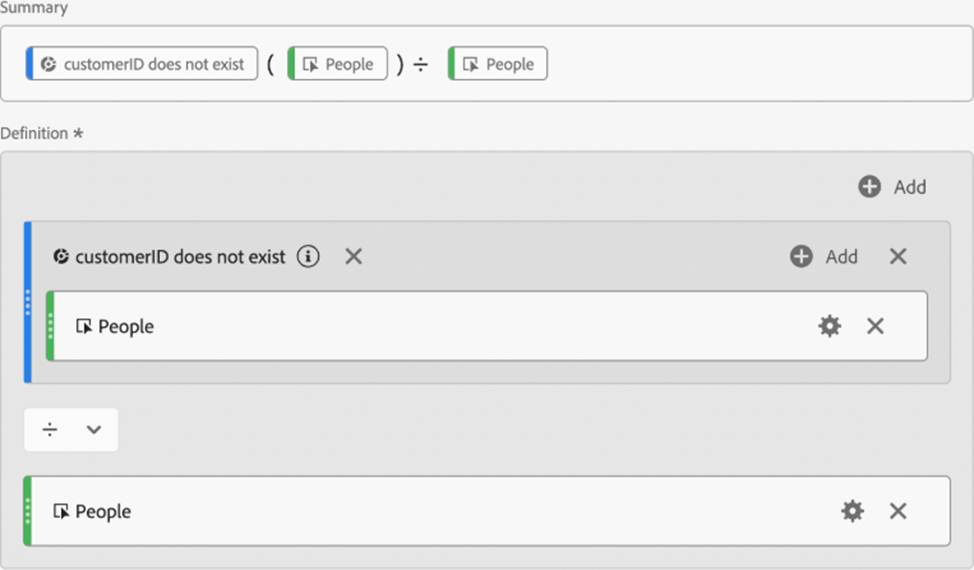
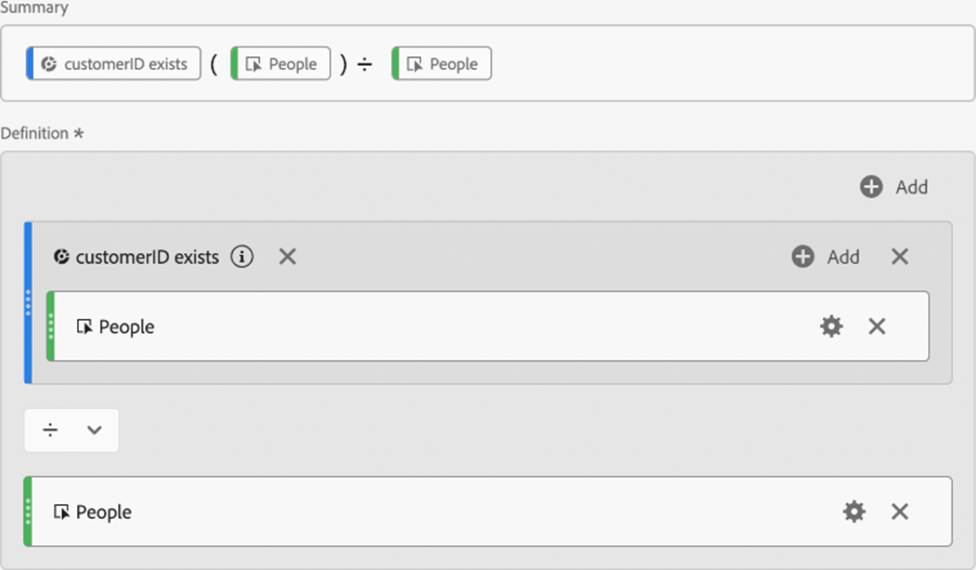
A business team is curious what percentage of web visitors are known vs. anonymous. A visitor becomes known when they either create an account or log in for the first time on a new browser. Creating an account or logging in appends a Customer ID to the user’s web events.
What calculated metric can be built to display the percentage of web visitors that are known?
- A . (Customer ID does not exist (People)) / People
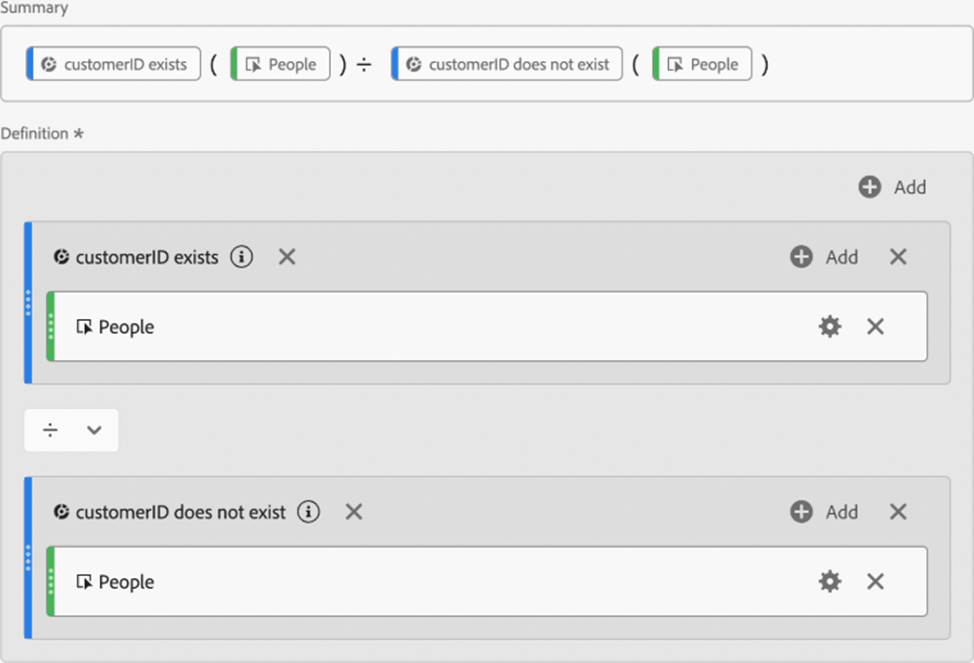
- B . (Customer ID exists (People)) / People
- C . (Customer ID exists (People)) / (Customer ID does not exist (People))
An analyst needs to show a trended view of the registered visitors to their website broken down by new registrations versus existing users. The website requires authentication and records an event when a user signs in. It also records an event when a new account is created.
How can the analyst create the desired visualization?
- A . Create a filter for users who create an account then sign in, another for users who sign in and exclude those who create an account, then use them both in a stacked bar chart.
- B . Create a filter for users who create an account, another for users who sign in and exclude those who create an account, then use them both in a stacked bar chart.
- C . Create a filter for users who create an account then sign in, another for users who sign in, then use them both to create a stacked area chart.
- D . Use a default visualization that plots sign-in and account creation events without filters.
Which component should be used to show customer engagement across different marketing channels?
- A . Segment Overlap Report
- B . Flow Visualization
- C . Data View Manager
- D . Engagement Tracker
Your team launched a multi-channel marketing campaign and requested a report tracking customer journeys. After reviewing the report, you notice that only email engagement data is displayed. After troubleshooting, you discover that identity stitching was not enabled.
What should be your next step?
- A . Enable identity stitching across data views and refresh the report.
- B . Create a calculated metric for customer journeys.
- C . Add a new campaign view for tracking all channels.
- D . Apply segment filters for other channels.
Which features enable data filtering and segmentation in Adobe CJA? (Select two.)
- A . Segments
- B . Calculated Metrics
- C . Event Flags
- D . Data Transfer Rules
The marketing team of an insurance business wants to review their weekly performance every Monday. They need a workspace project with data for past week from Monday to Sunday for reporting.
As a CJA Business Practitioner, how will you create a custom calendar date range to address this requirement, considering the week starts from Sunday as per default data view calendar settings?
- A . In the calendar control check ‘Use rolling dates’ option and choose Start as ‘Start of current week’ plus 1 day and End as ‘Start of current week’ plus 8 days
- B . In the calendar control check ‘Use rolling dates’ option and choose Start as ‘Start of current week’ minus 6 days and End as ‘Start of current week’ plus 1 day
- C . In the calendar control select ‘Last 7 days’ from the Preset dropdown and then uncheck ‘Use rolling dates’ option with rolling weekly value
- D . Select a custom range and manually adjust the start and end dates every week
Your manager wants to review a report on website traffic and purchase conversion rates. After creating the report, you realize the purchase conversion metric is not visible. Upon investigation, you find that the metric was not included in the data view configuration.
What should you do next?
- A . Add the purchase conversion metric to the data view and refresh the report.
- B . Reprocess all web traffic data.
- C . Use the calculated metrics feature to estimate purchase conversions.
- D . Enable real-time data synchronization.