Tableau TDA-C01 Practice Exams
Last updated on Oct 21,2026- Exam Code: TDA-C01
- Exam Name: Tableau Certified Data Analyst Exam
- Certification Provider: Tableau
- Latest update: Oct 21,2026
You have the following dashboard that contains two visualizations.
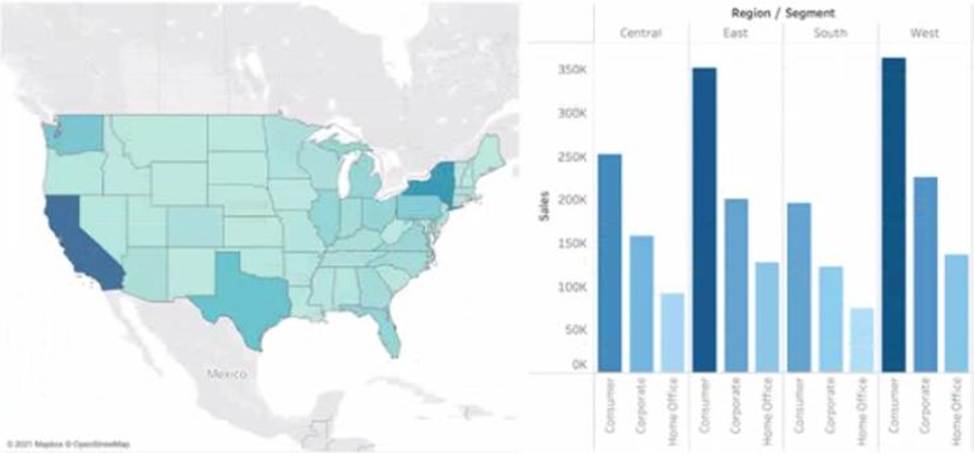
You want to show only visualization at time. Users must be able to switch between visualizations.
What should you me?
- A . A parameter and a calculated filed
- B . Worksheet actions
- C . Showhide buttons
- D . Dashboard actions
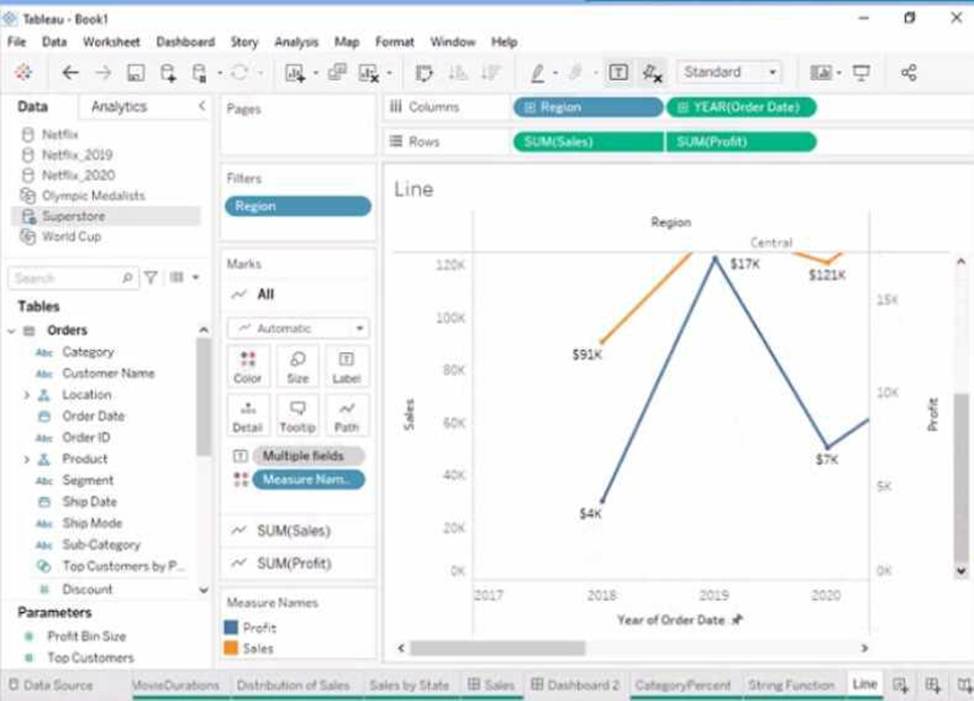
Open the link to Book1 found on the desktop. Open the Line worksheet.
Modify the chart to show only main and max values of both measures in each region.
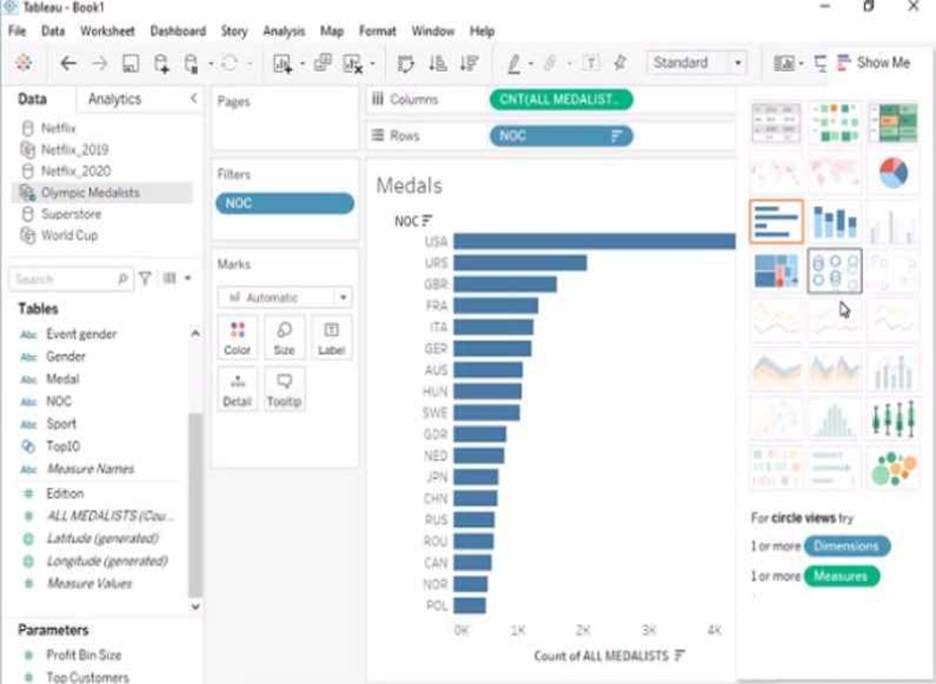
Open the link to Book1 found on the desktop. Open Disciplines worksheet.
Filter the table to show the Top 10 NOC based on the number of medals won.
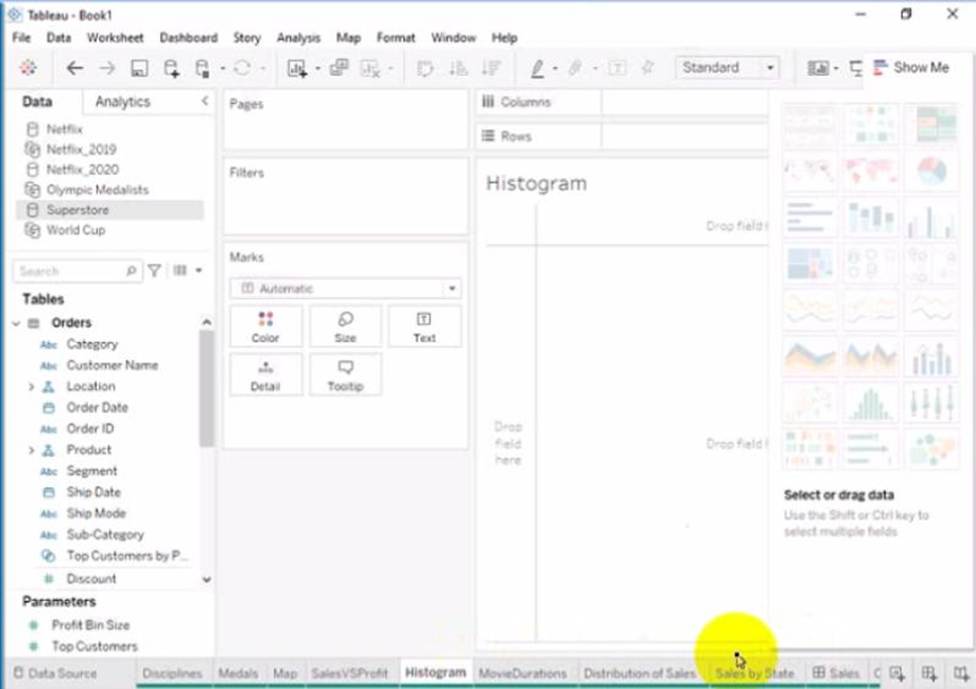
Open the link to Book1 found on the desktop. Open the Histogram worksheet and use the Superstone data source.
Create a histogram on the Quantity field by using bin size of 3.
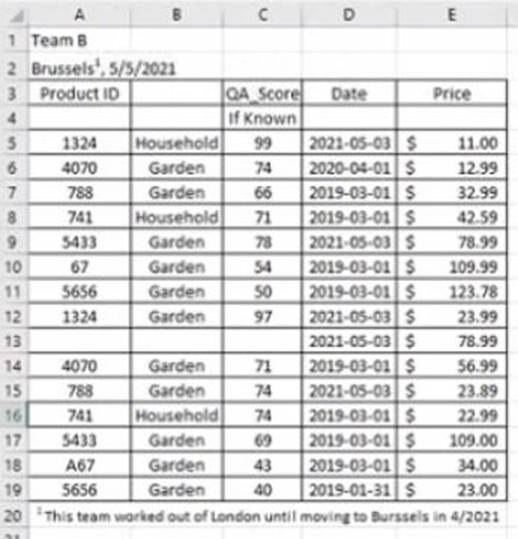
You have the following dataset in Microsoft Excel.
You are using interpreter to cleans the dataset.
Data interpreter provides the following results.
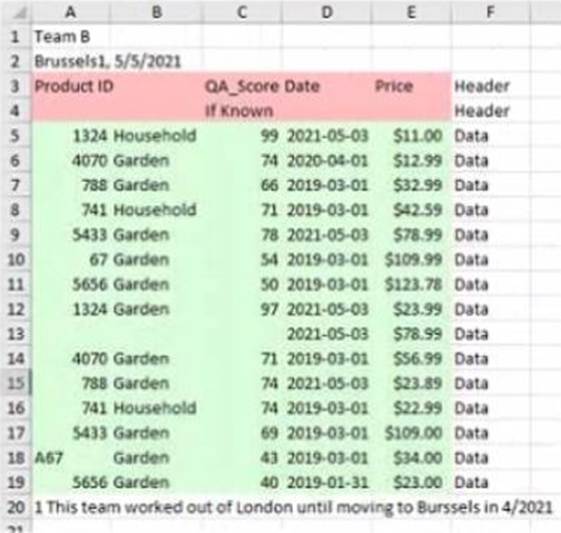
How many rows of data will be ingested into Tableau as values?
- A . 10
- B . 20
- C . 17
- D . 15
DRAG DROP
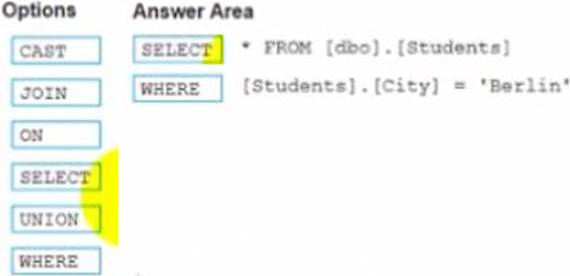
You conned to a Microsoft SQL Server database
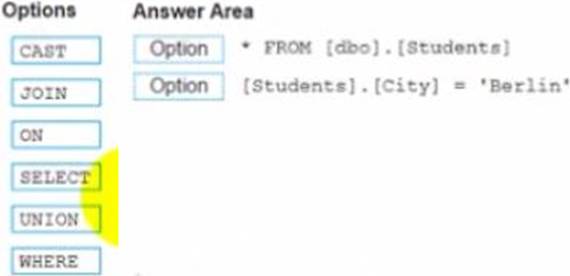
You need to create a custom SQL query that retrieves rows from a table named Students Only students m the city of Berlin must be returned
How should you complete the query? (Drag the appropriate Options to the Answer Area and drop into the correct locations.)
From Tableau Desktop you sign in lo a Tableau Server site.
What appears in the list of available data sources when you search for a published data source?
- A . All the data sources published to the site
- B . All the data sources published to the Tableau Server
- C . All the data sources published to the site within the folders to which you have access
- D . All the data sources published to the Tableau Server within the folders to which you have access
You plan to create a visualization that has a dual axis chart. The dual axis chart will contain a shape chart and a line chart will use the same measure named Population on the axis. You need to configure be shapes to be much larger than the line.
What should you do?
- A . Duplicate Population Drag the duplicate to the second Marks card and configure the see of the marks independently
- B . Create a custom shape that is larger than the default shape and add the shape to the Shapes folder in My Repository
- C . For the second axis select Shape on the Marks card From Select Shape Palette select Custom and then select Reset
- D . Change Population to a discrete dimension
You publish a dashboard tut uses an attract. The extract refreshes every Monday at 10:00.
You need to ensure that the extract also refreshes on the last day of the month at 18:00.
What should you do?
- A . From Tableau Desktop, open the Publish Workbook dialog box and configure the schedule.
- B . From Tableau Server select the workbook select Refresh Extracts and then add a new extract refresh
- C . From Tableau Server. select Schedules find the schedule of the extract, and change the frequency to the Last day of the month
- D . From Tableau Server. select Schedules and change the priority of the existing schedule
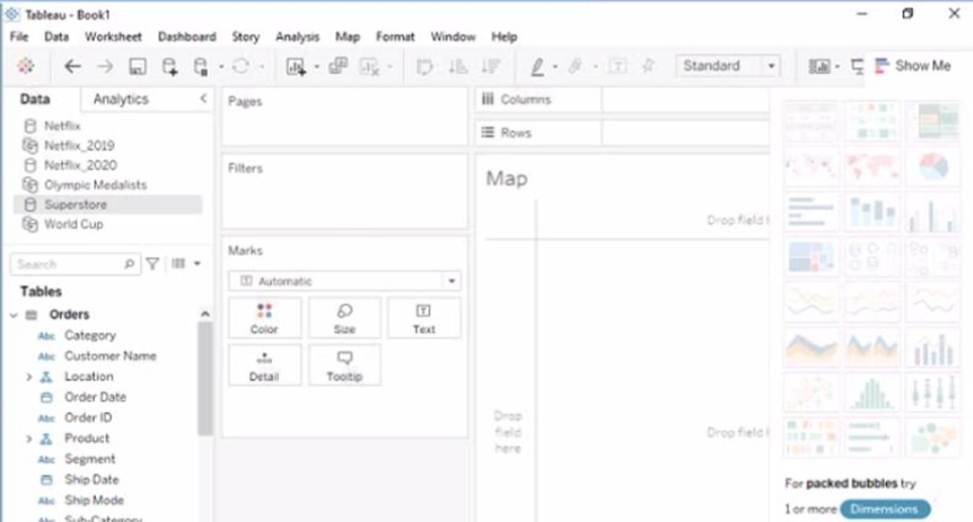
Open the Link to Book1 found on the desktop. Open Map worksheet and use Superstore data source.
Create a filed map to show the distribution of total Sales by State across the United States.