Tableau TDA-C01 Practice Exams
Last updated on Oct 21,2026- Exam Code: TDA-C01
- Exam Name: Tableau Certified Data Analyst Exam
- Certification Provider: Tableau
- Latest update: Oct 21,2026
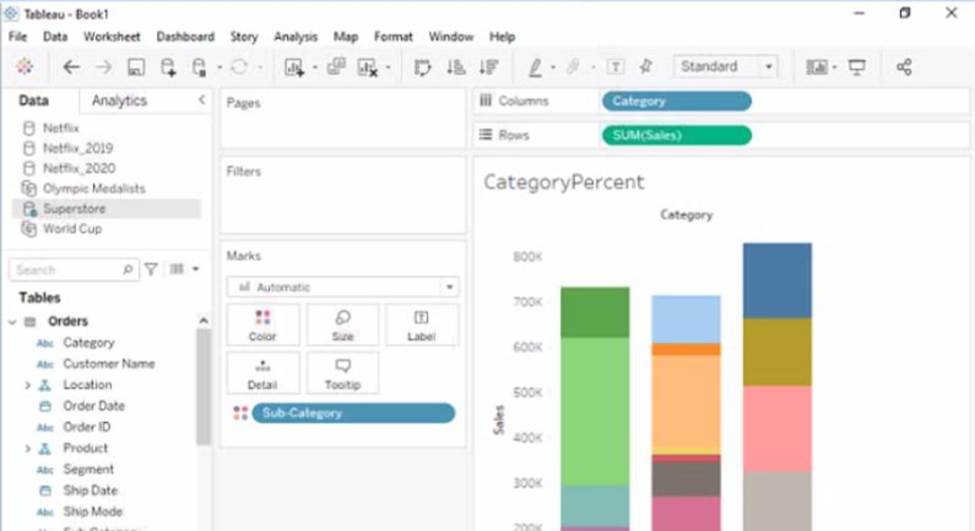
Open the link to Book1 found on the desktop. Open the CategoryPercentage worksheet.
Modify the bar chart show the percentage of sales for each Subcategory within every Category. The total percentage for every Category must be 100%.
HOTSPOT
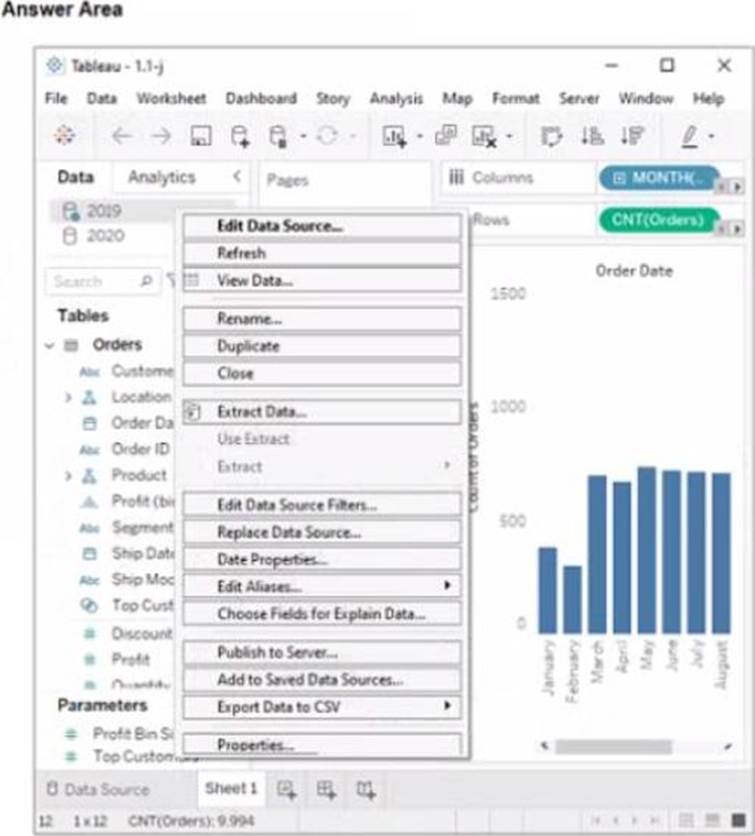
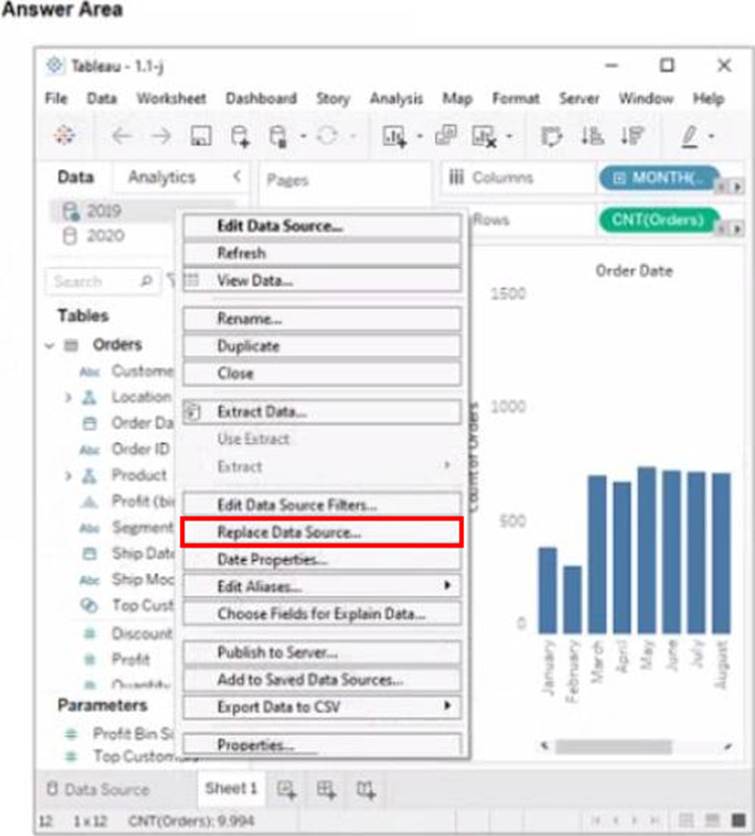
You have two data sources that use the same schema One data source contains order data from 2019 and the other data source contains order data from 2020. You have a worksheet that shows the orders from 2019.
You need to configure the worksheet to show the orders from 2020 without reloading the data.
Which option should you select?
You have a dashboard that contains confidential information about patients health. The data needs to always be up to date tor a team of healthcare workers.
How should you share me dashboard with the healthcare workers?
- A . Publish the dashboard to Tableau Public
- B . Print the dashboard to PDF
- C . Publish aw dashboard to Tableau Server
- D . Export the dashboard as a .twbx
HOTSPOT
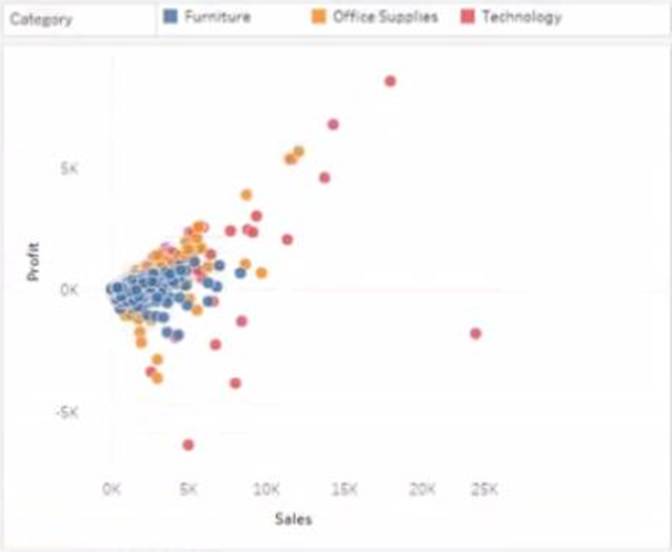
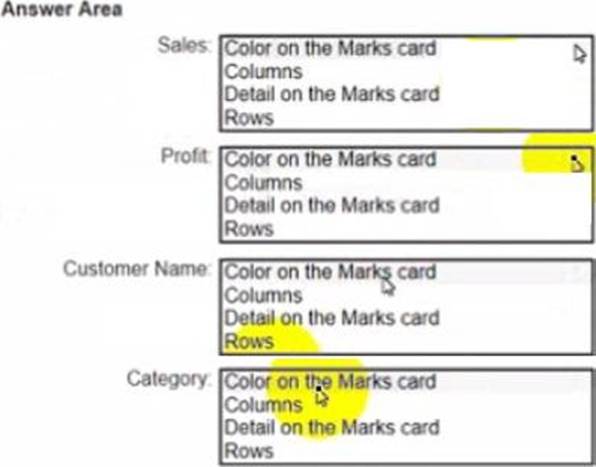
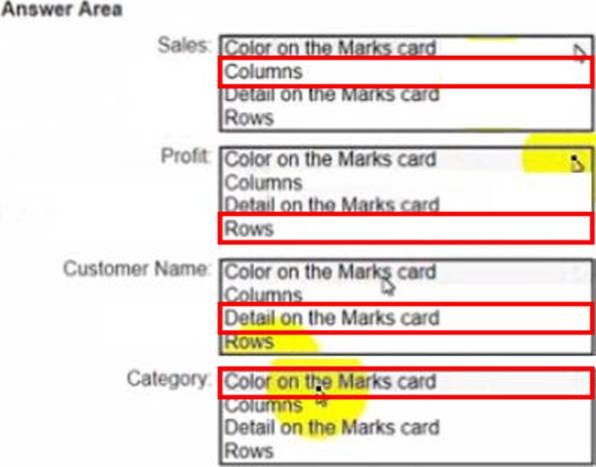
You have a dataset that has four fields named Category. Profit Sates and Customer Name.
You need to create the following visualization.
Open the link to Book1 found on the desktop. Use the Superstore data source.
Split the Customer Name field into two fields named First Name and Last Name.
You have a database that includes field named sales, City and Region.
You have the following chart that shows the number of sales made in different cities.
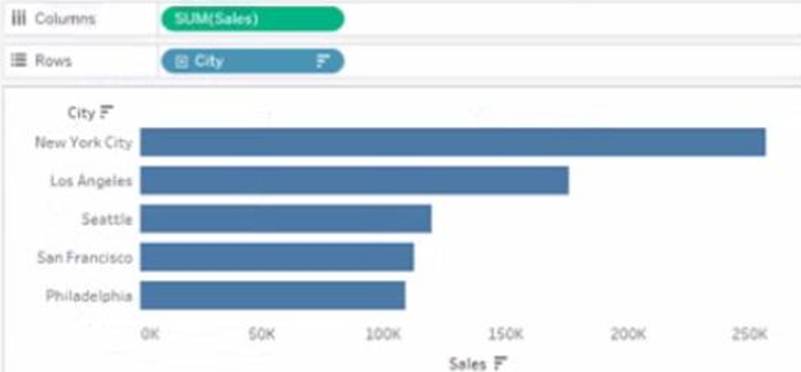
You want to dynamically show the corresponding region when users hover their mouse over any of the bars.
What should you do?
- A . Right-click a in the chat, select Annotate and then select Mark.
- B . Right-click a bar in the chart select Mark Label and then select Always show.
- C . Edit the aliases for City.
- D . Drag Region to Tooltip on the Marks card
You have the following tiled dashboard that has one sheet.
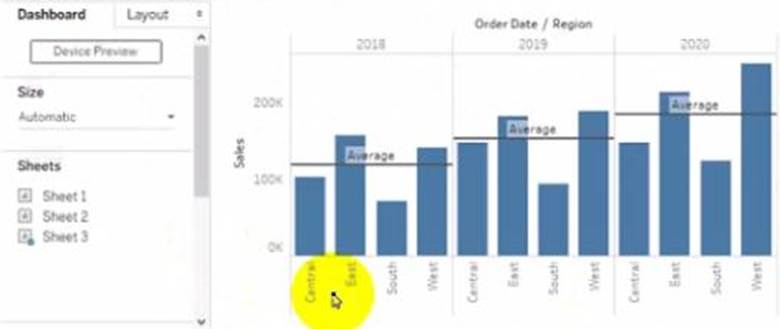
You want to replace fit sheet with Sheet2.
What should you do?
- A . Right-click Sheet2 and select Add to Dashboard.
- B . Select Sheets and click the Swap Sheet button next to Sheet2.
- C . From the context menu of Sheet3. select Remove Dashboard item
- D . Drag Sheet2 to the dashboard.
- E . From the context menu of Sheet3. select Deselect
You have the following data source in tableau Server.
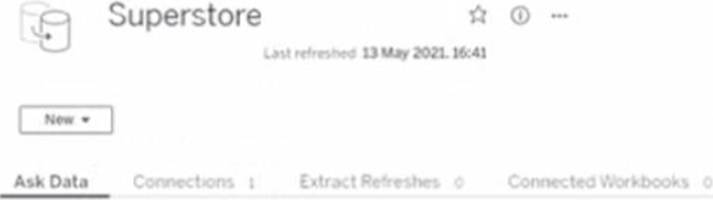
You need to ensure that the data is updated every hour.
What should you select?
- A . New
- B . Extract Refreshes
- C . Connected Workbooks
- D . Connections
You have a line chart on a worksheet.
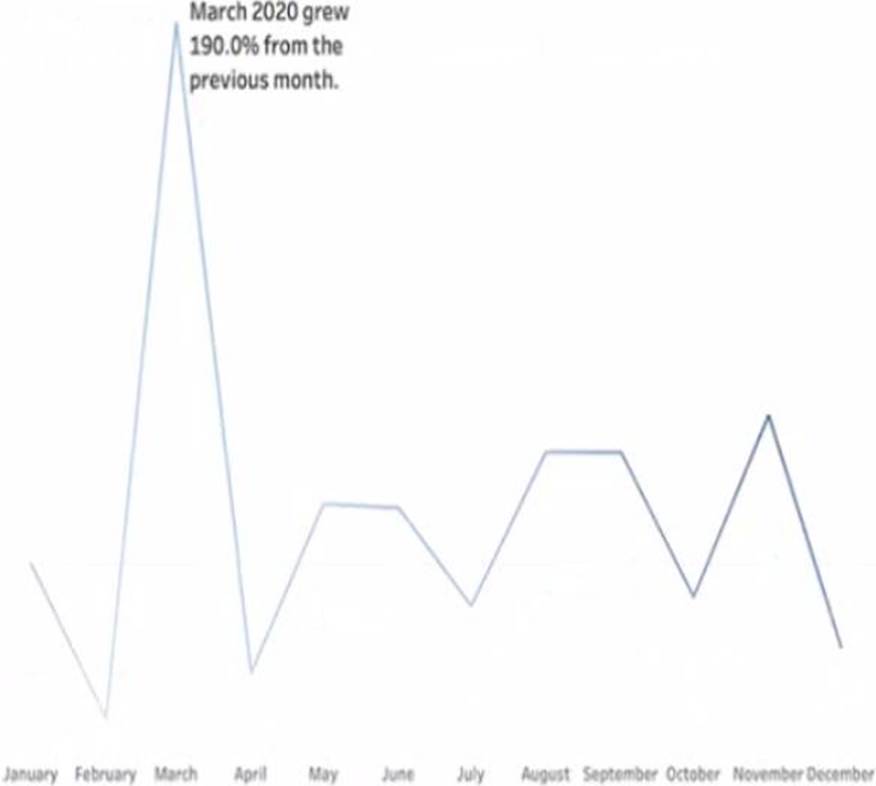
You want to add a comment to March 2020 as shown in the following visualization.
What should you do?
- A . Drag the growth rate to Text on the Marks card
- B . Enable captions
- C . Annotate March 2020
- D . Add a tooltip
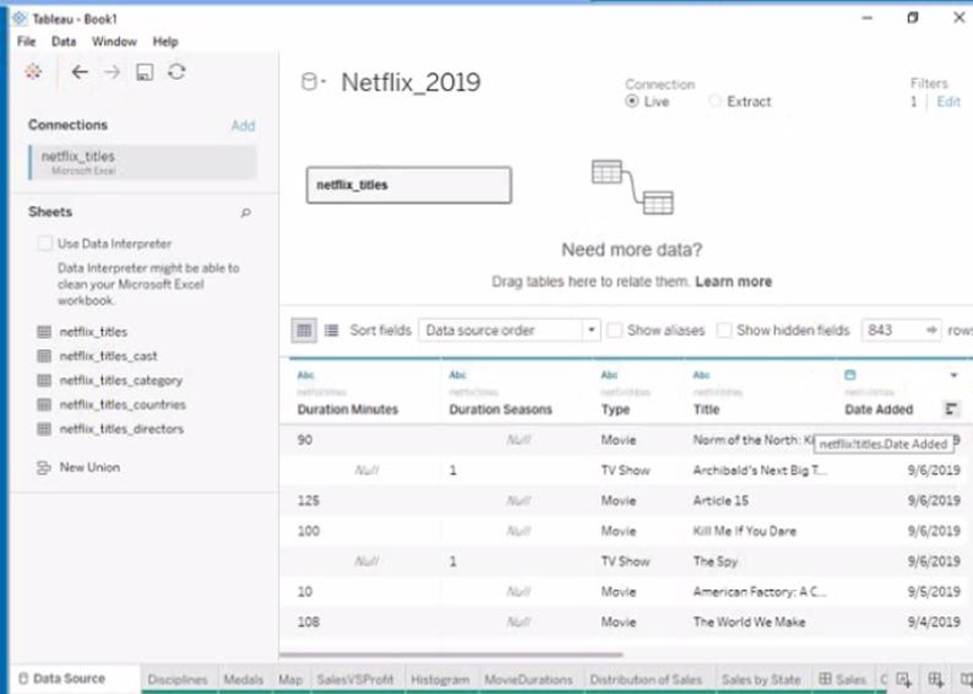
Open the link to Book1 found on the desktop. Open the Movie Durations worksheet.
Replace the existing data source with the Netflix_2019 data source.