
SAS Institute A00-470 Practice Exams
Last updated on Oct 21,2026- Exam Code: A00-470
- Exam Name: SAS Visual Analytics Using SAS Viya
- Certification Provider: SAS Institute
- Latest update: Oct 21,2026
Refer to the exhibit below:
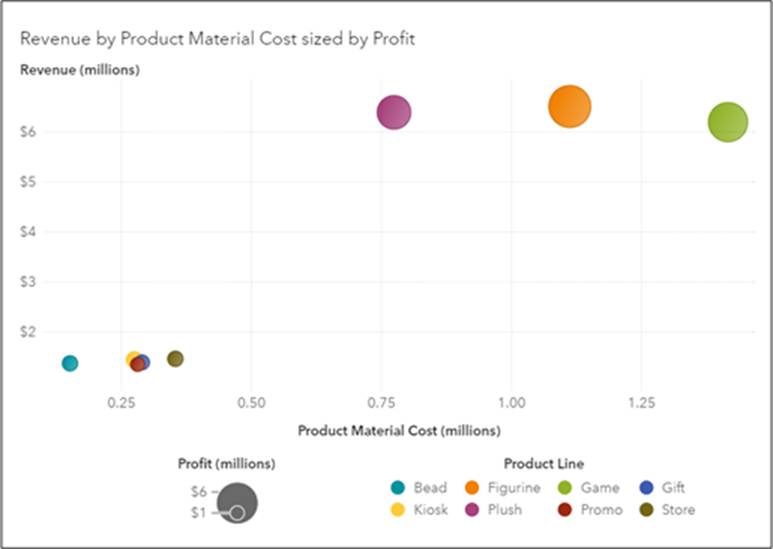
For this Bubble plot object created in SAS Visual Analytics, which statement about the data item role assignments is true?
- A . Revenue is assigned to the Lattice rows role.
- B . Product Line is assigned to the Group role.
- C . Profit is assigned to the Animation role.
- D . Product Material Cost is assigned to the Measures role.
Refer to the exhibit below:
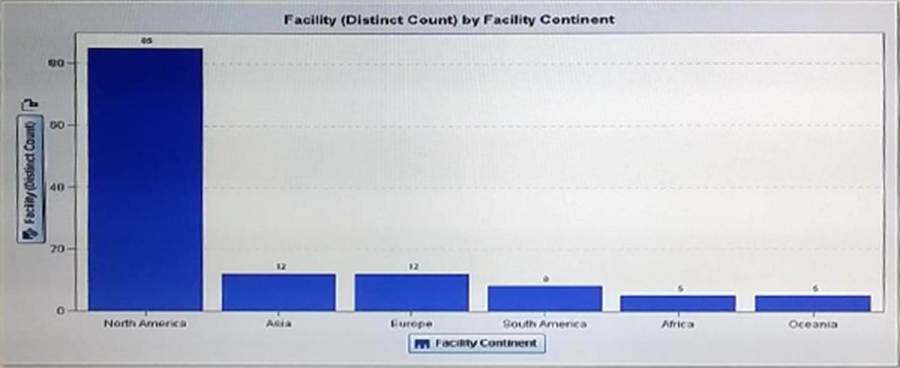
How does the content developer create the facility (Distinct Count) data Item?
- A . Change the classification property of Facility content to distinct count measure
- B . Change the aggregation of Facility to Distinct count
- C . Create a new custom category that displays the distinct count
- D . Right click on Facility and select create Distinct count
Which statement is TRUE about report alerts?
- A . Alert notifications can be sent to subscribers via email.
- B . Alert notifications are only sent to the user that created the alert.
- C . Alert notifications are only sent when the report is open.
- D . Alerts can be set on an individual object and the entire report.
Refer to the exhibit:
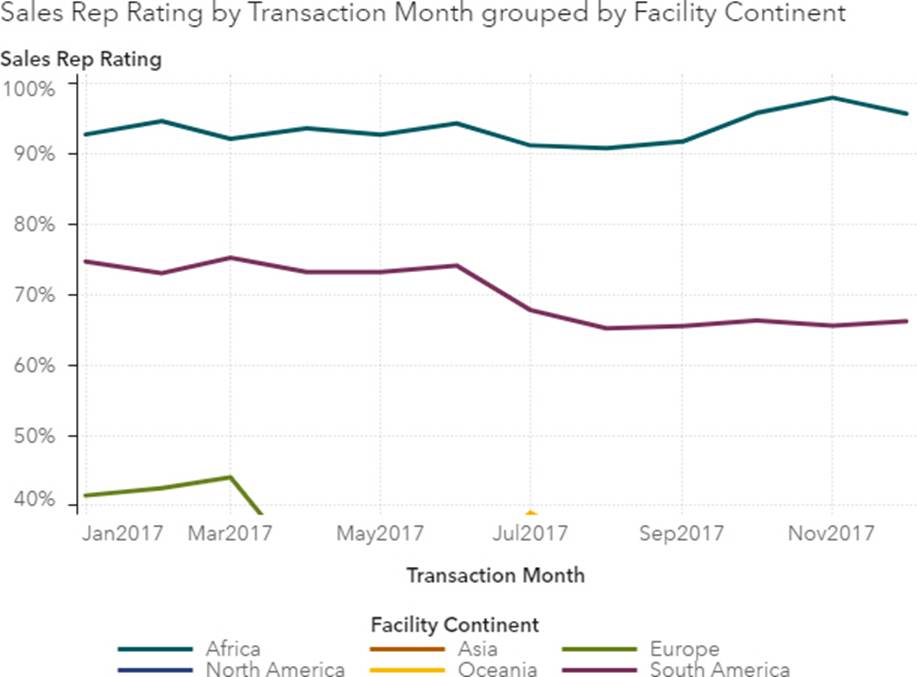
The report designer has just changed the filter to add more data to this line chart.
Why are some of the lines outside of view?
- A . Fixed minimum and maximum has been set on the axis.
- B . The data does not fit.
- C . There is too much data for a line chart.
- D . Data outside of the chart can be ignored.
How many data sources can each report section have in SAS Visual Analytics Designer?
- A . 1
- B . 250
- C . it is determined by the preferences
- D . Unlimited
Which statement is TRUE about the Image object?
- A . Scale for the image cannot be adjusted.
- B . Links cannot be added to images.
- C . Images can be loaded from a URL.
- D . An image can be placed in the Report prompt area.
Refer to the exhibit below:
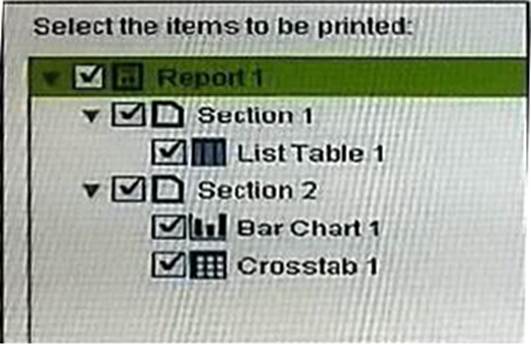
Select the Items to be printed: list table 1, Bar chart1, Crosstab 1. A SAS Visual Analytics Designer report is created, the user select File > Print to PDF and the selects all of the check boxes shown in the exhibit.
How many objects will be printed?
- A . 6
- B . 2
- C . 5
- D . 3
Which object can be the source of an action?
- A . Scatter plot
- B . Crosstab
- C . Time series plot
- D . Forecasting
Refer the exhibit below:
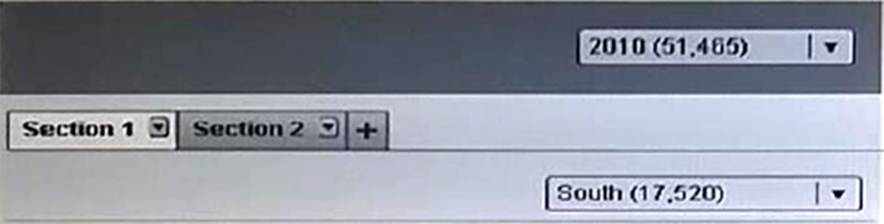
A content developer creates the above report in SAS Visual Analytics Designer. The report contains a report prompt, where year is set to 2010, and a section prompt on section 1 where region is set to south.
How will this report be filtered based on these prompt values?
- A . Section1 will be filtered for region=south. section 2 will be filtered for year=2010
- B . Section1 and section 2 will be filtered for region=south and for year=2010
- C . Section1 will be filtered for Year=2010 and region=south. section 2 will be filtered for year=2010
- D . Section1 will be filtered for Year=2010 and region=south. section 2 will not be filtered.
Refer to the exhibit:
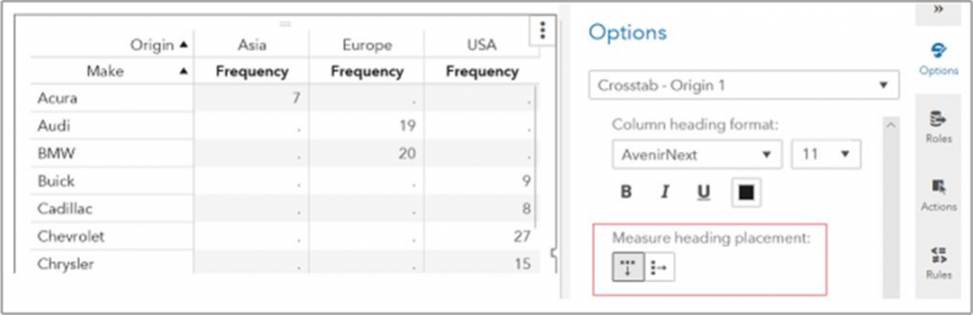
Which is TRUE when the Measure heading placement is changed?
- A . Frequency is moved to the rows.
- B . Origin and Frequency are moved to the rows.
- C . The rows and columns are transposed.
- D . Frequency is left justified on the column.