
SAS Institute A00-470 Practice Exams
Last updated on Oct 21,2026- Exam Code: A00-470
- Exam Name: SAS Visual Analytics Using SAS Viya
- Certification Provider: SAS Institute
- Latest update: Oct 21,2026
When importing a Microsoft Excel file using local files, what changes can be made to the destination table?
- A . Rename table
- B . Hide columns
- C . Format columns
- D . Filter rows
The content developer has just changed the filter to add more data to this line chart in SAS visual analytics Explorer, are some of the lines outside of view?
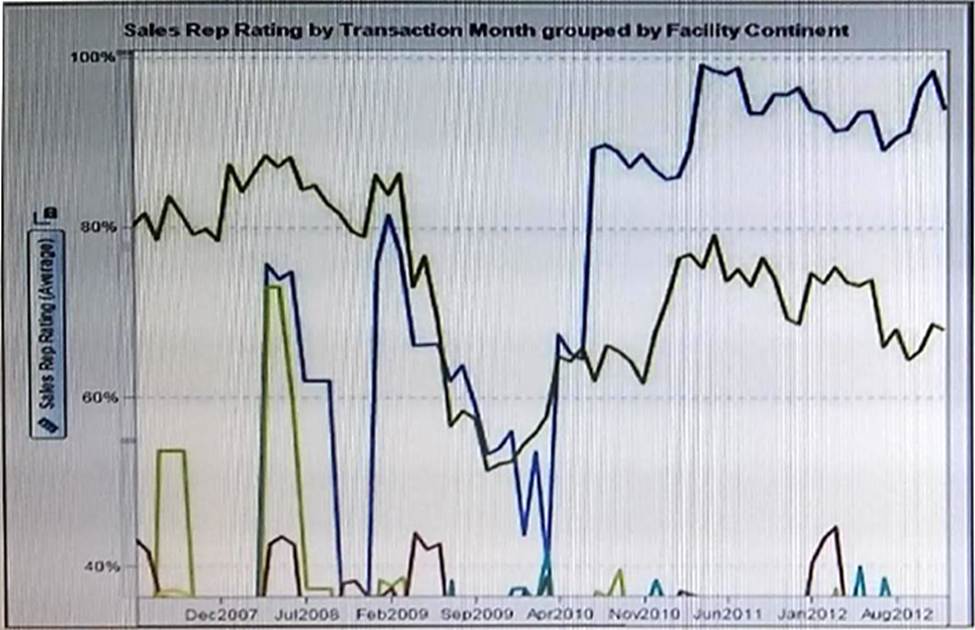
- A . The data does not fit
- B . Data Outside of the can be ignored
- C . there is too much data for a line chart
- D . The vertical Axis is locked
Refer to the Exhibit below:
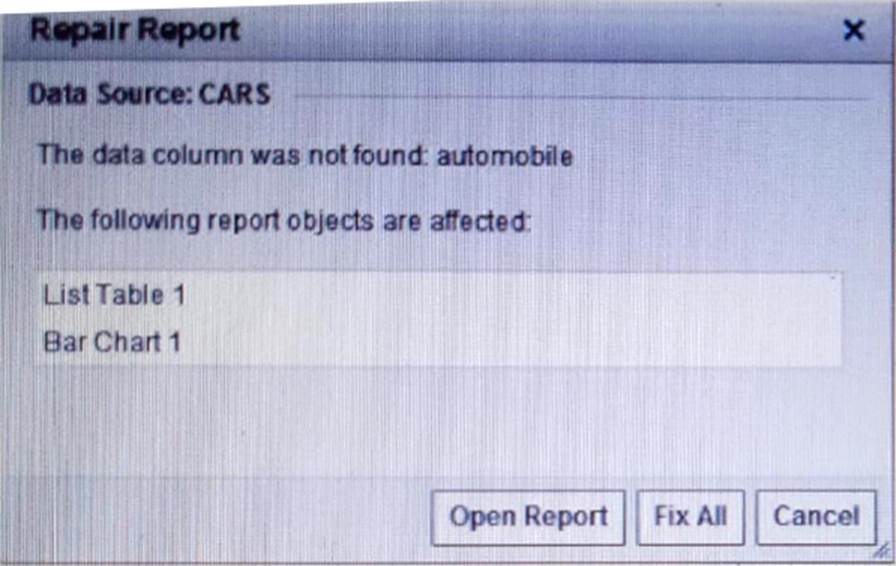
What Causes this window to Display?
- A . The List Table 1 report object was edited but not saved.
- B . Report Object Bar Chart1 was built with multiple data sources.
- C . Automobile was removed from the Cars Metadata
- D . The Cars Data source no longer exists.
Refer to the Exhibit below, a Bar chart is given:
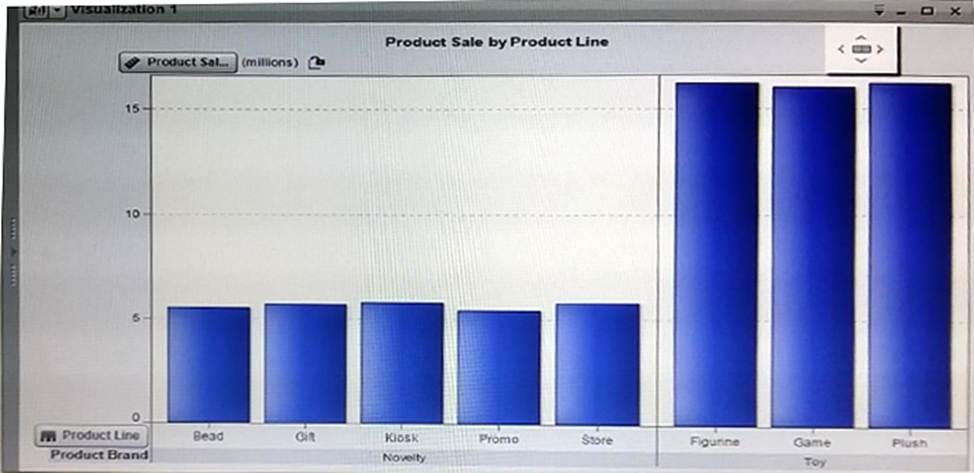
The bar chart shown in the exhibit is created using the automatic chart feature. There are several ways to change this visualization type is SAS Visual Analytics Explorer.
Which method is not applicable?
- A . Select a new visualization type using the drop down arrow in the top left corner of the automatic chart.
- B . Select visualization on the menu bar and select another type of visualization.
- C . Drag the new visualization type from the objects tab in the left pane
- D . Select another visualization type from the toolbar.
When adding a data source to a query within SAS Visual data builder, which columns are added to the output table by default?
- A . No columns
- B . Only columns common to all tables
- C . All columns
- D . Character and numeric columns
There are two visualizations given in the area:
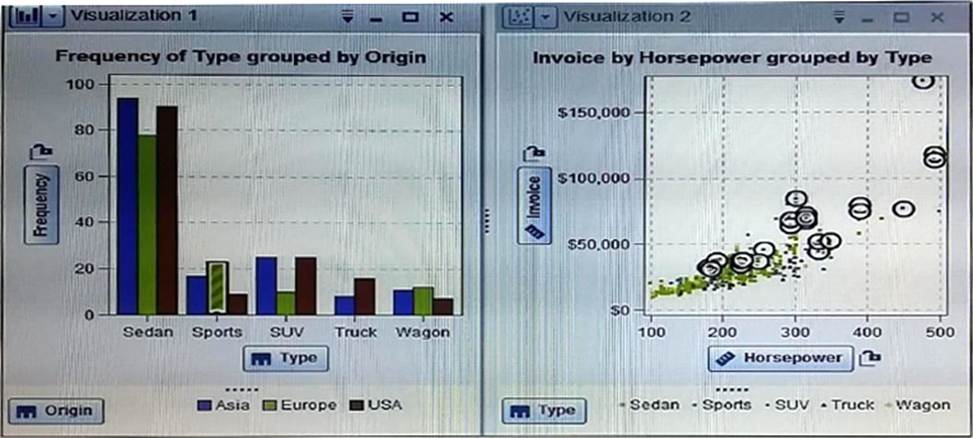
When a bar is selected in the bar chart, the markers in the scatter plot that correspond to the selected value in the bar area are highlighted.
This feature used in SAS Visual Analytics Explorer called:
- A . Report level display rules
- B . Data Brushing
- C . Conditional Highlighting
- D . File interaction
Refer to the exhibit below:
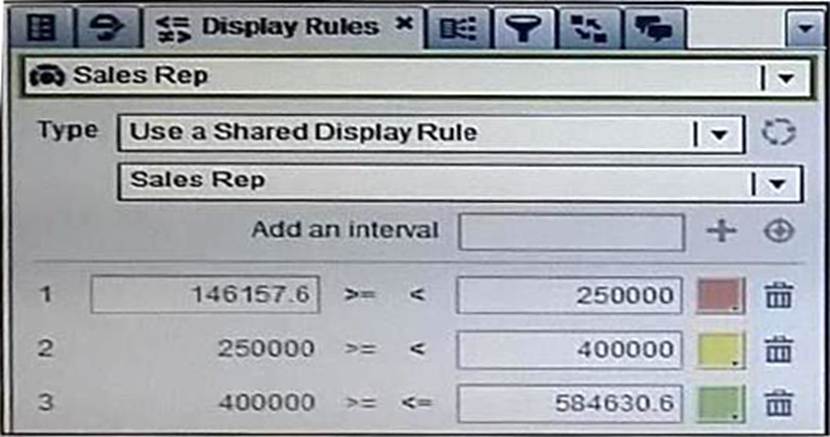
Why are the interval value cells grayed out?
- A . You must use shared rules to edit the values
- B . Once interval values are created they cannot be edited
- C . You must select the row before it comes editable
- D . You do not have permission to edit the report.
Refer to the exhibit below:
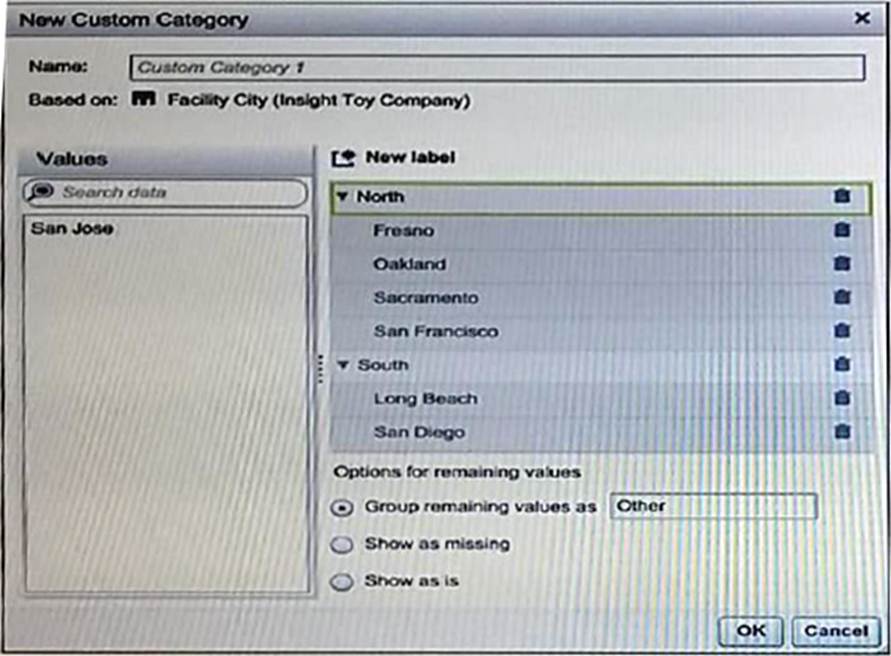
Assuming that there are data values for each city, how many different labels will be displayed when using this data item?
- A . 2
- B . 3
- C . 6
- D . 7
Refer to the Exhibit below:
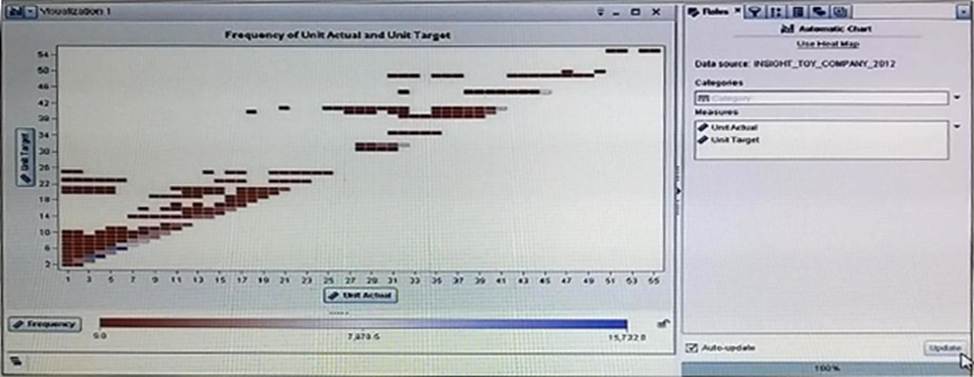
- A . The data item has few unique items
- B . The Heat map visualization was selected on the tool bar
- C . Use Heat map was selected on the roles tab
- D . The data item has high cardinality.
Refer to the list table from SAS Visual Analytics Designer below.
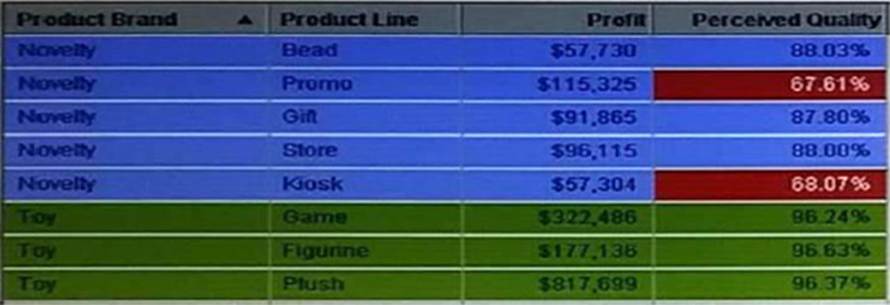
Select two types of display rules that are applied to this list table report object. (Choose Two).
- A . A cell mapped values display rule
- B . a Color mapped valued Display rule
- C . a Row mapped valued Display rule
- D . an expression Display rule