
Microsoft DP-600 Practice Exams
Last updated on Oct 02,2026- Exam Code: DP-600
- Exam Name: Implementing Analytics Solutions Using Microsoft Fabric
- Certification Provider: Microsoft
- Latest update: Oct 02,2026
You need to ensure the data loading activities in the AnalyticsPOC workspace are executed in the appropriate sequence. The solution must meet the technical requirements.
What should you do?
- A . Create a dataflow that has multiple steps and schedule the dataflow.
- B . Create and schedule a Spark notebook.
- C . Create and schedule a Spark job definition.
- D . Create a pipeline that has dependencies between activities and schedule the pipeline.
D
Explanation:
Microsoft Fabric, Ingest data into OneLake and analyze with Azure Databricks
You can do this with a pipeline in a workspace and ingest data into your OneLake in Delta format.
Read and modify a Delta table in OneLake with Azure Databricks.
Note: Power BI dataflows enable you to connect to, transform, combine, and distribute data for downstream analytics. A key element in dataflows is the refresh process, which applies the transformation steps you authored in the dataflows and updates the data in the items themselves.
Scenario:
Technical Requirements
Files loaded by the data engineers to OneLake will be stored in the Parquet format and will meet Delta Lake specifications.
Data will be loaded without transformation in one area of the AnalyticsPOC data store. The data will then be cleansed, merged, and transformed into a dimensional model
The data load process must ensure that the raw and cleansed data is updated completely before populating the dimensional model
Planned change:
The data engineers will create data pipelines to load data to OneLake either hourly or daily depending on the data source. The analytics engineers will create processes to ingest, transform, and load the data to the data store in the AnalyticsPOC workspace daily. Whenever possible, the data engineers will use low-code tools for data ingestion. The choice of which data cleansing and transformation tools to use will be at the data engineers’ discretion.
Reference:
https://learn.microsoft.com/en-us/fabric/onelake/onelake-open-access-quickstart
https://learn.microsoft.com/en-us/power-bi/transform-model/dataflows/dataflows-understand-optimize-refresh
HOTSPOT
You have a Fabric tenant that contains a semantic model named model1.
The two largest columns in model1 are shown in the following table.
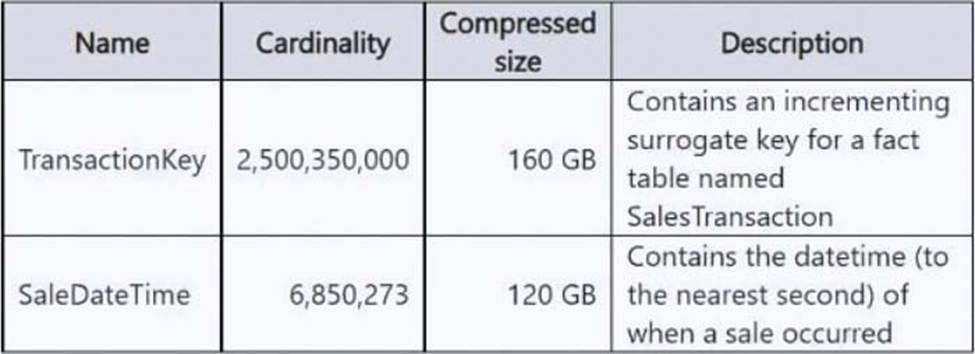
You need to optimize model1.
The solution must meet the following requirements:
– Reduce the model size.
– Increase refresh performance when using Import mode.
– Ensure that the datetime value for each sales transaction is available in the model.
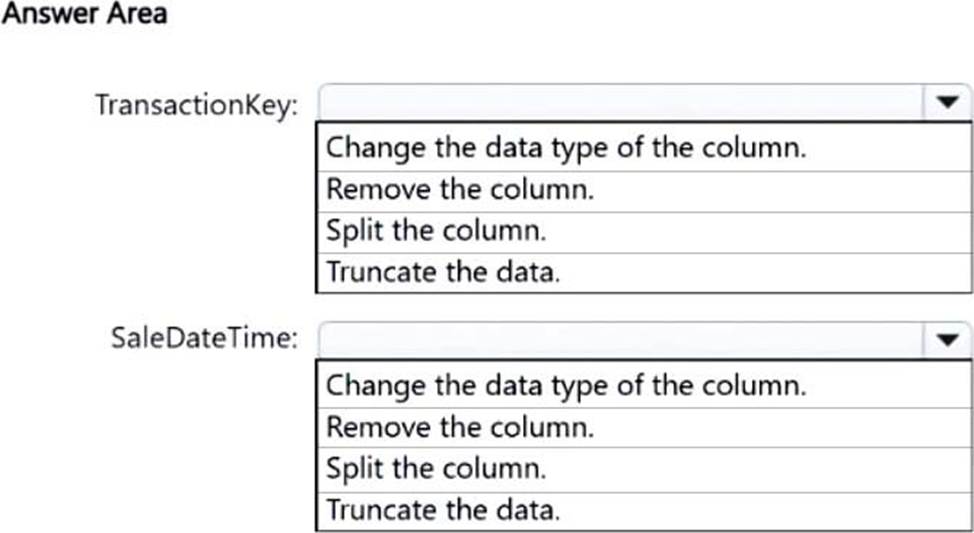
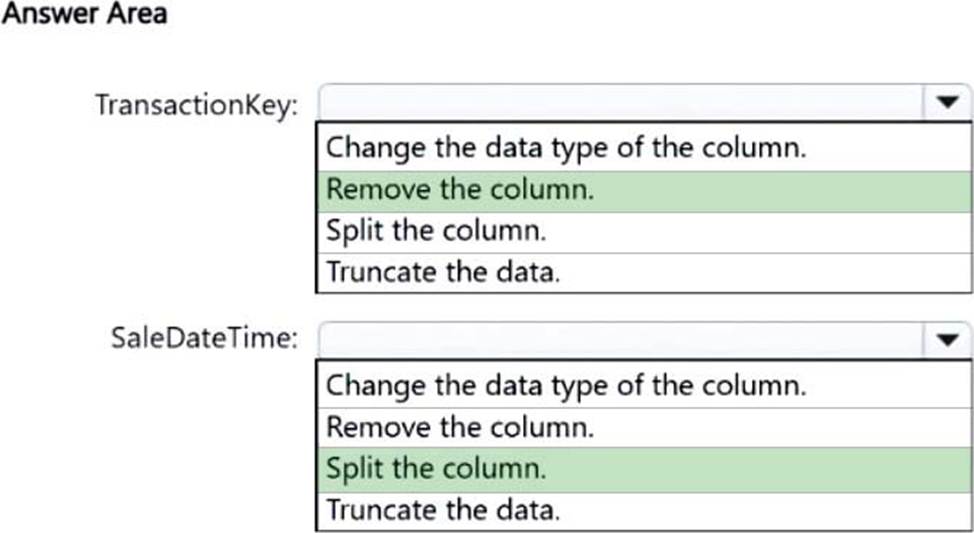
What should you do on each column? To answer, select the appropriate options in the answer area. NOTE: Each correct selection is worth one point.
Explanation:
Box 1: Remove the column.
TransactionKey
Remove the surrogate key.
Box 2: Split the column
SaleDateTime
Split the datetime column.
Reference: https://powerbi.microsoft.com/pl-pl/blog/best-practice-rules-to-improve-your-models-performance/
HOTSPOT
You are creating a report and a semantic model in Microsoft Power BI Desktop.
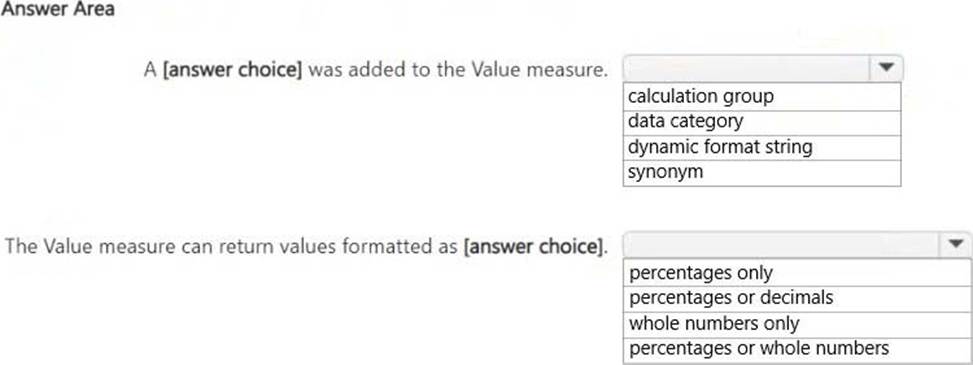
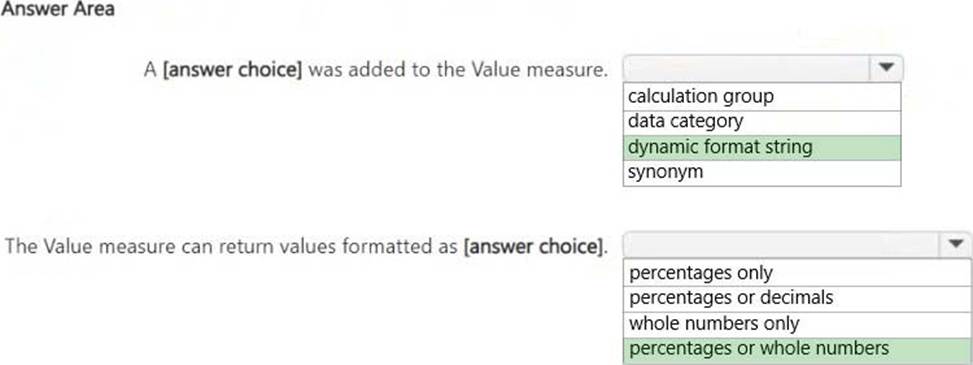
The Value measure has the expression shown in the following exhibit.
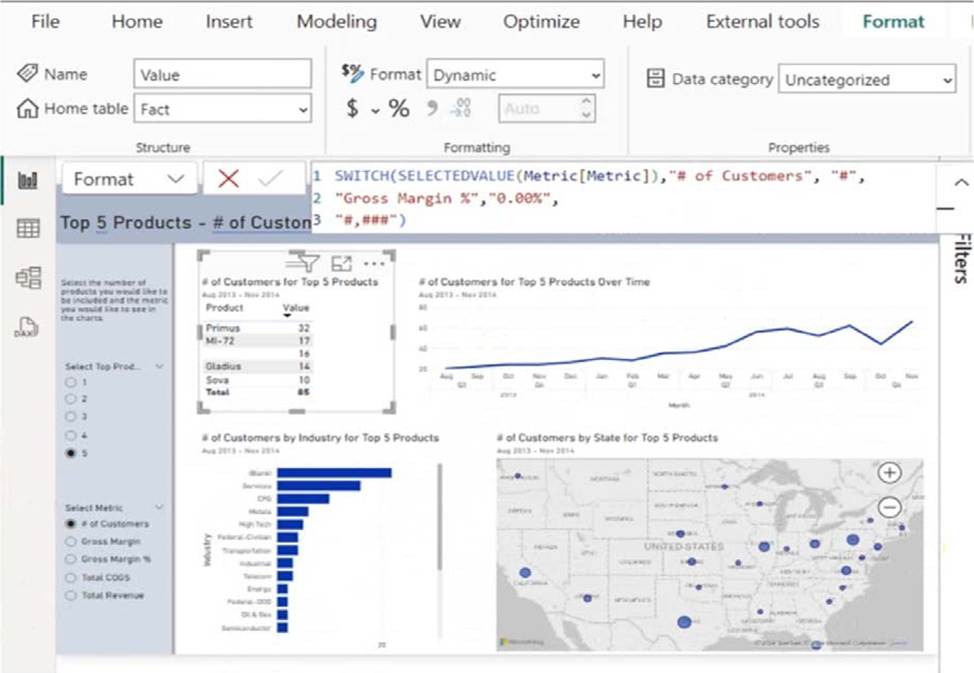
Use the drop-down menus to select the answer choice that completes each statement based on the information presented in the graphic. NOTE: Each correct selection is worth one point.
Explanation:
A dynamic format string was added to the Value measure.
The Value measure can return values formatted as percentages or whole numbers.
Dynamic Format String:
The DAX formula uses SWITCH(SELECTEDVALUE(Metric[Metric]), …)to dynamically change the format of the Value measure. This is a dynamic format string, which allows the measure to return either whole numbers (#) or percentages (0.00%), depending on the selected metric.
Formatted as Percentages or Whole Numbers:
The formula specifies that if the metric is "# of Customers", the output is formatted as a whole number (#,###). If the metric is "Gross Margin %", the output is formatted as a percentage (0.00%). Since the measure can return both whole numbers and percentages, the correct answer is "percentages or whole numbers."
HOTSPOT
You have a Fabric tenant that contains a lakehouse named Lakehouse1.
Lakehouse1 contains a table named Nyctaxi_raw. Nyctaxi_raw contains the following table:
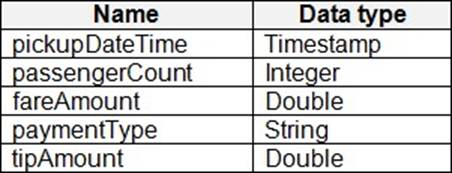
You create a Fabric notebook and attach it to Lakehouse1.
You need to use PySpark code to transform the data.
The solution must meet the following requirements:
– Add a column named pickupDate that will contain only the date portion of pickupDateTime.
– Filter the DataFrame to include only rows where fareAmount is a positive number that is less than 100.
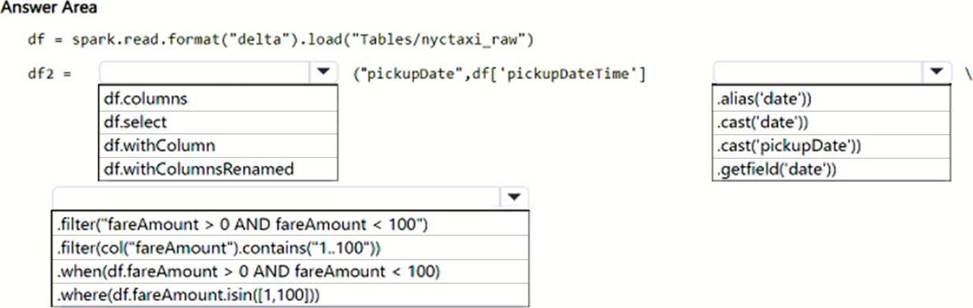
How should you complete the code? To answer, select the appropriate options in the answer area. NOTE: Each correct selection is worth one point.
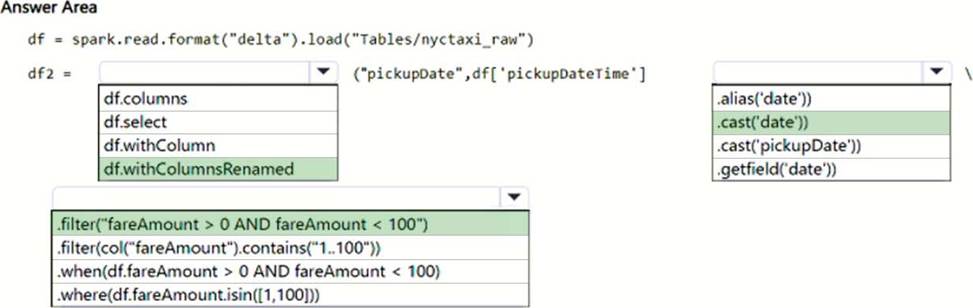
Explanation:
Box 1: df.withColumnRenamed
Add a column named pickupDate that will contain only the date portion of pickupDateTime.
withColumnRenamed(existing, new)[source]
Returns a new DataFrame by renaming an existing column. This is a no-op if schema doesn’t contain the given column name.
Parameters:
existing C string, name of the existing column to rename.
col C string, new name of the column.
>>> df.withColumnRenamed(‘age’, ‘age2′).collect() [Row(age2=2, name=’Alice’), Row(age2=5, name=’Bob’)]
Incorrect:
* df.withColumn withColumn(colName, col)[source]
Returns a new DataFrame by adding a column or replacing the existing column that has the same name.
The column expression must be an expression over this DataFrame; attempting to add a column from some other dataframe will raise an error.
Parameters:
colName C string, name of the new column.
col C a Column expression for the new column.
>>> df.withColumn(‘age2’, df.age + 2).collect()
[Row(age=2, name=’Alice’, age2=4), Row(age=5, name=’Bob’, age2=7)]
Box 2: cast(‘date’)
cast(dataType)[source]
Convert the column into type dataType.
>>> df.select(df.age.cast("string").alias(‘ages’)).collect() [Row(ages=’2′), Row(ages=’5′)]
>>> df.select(df.age.cast(StringType()).alias(‘ages’)).collect() [Row(ages=’2′), Row(ages=’5′)]
Box 3: .filter("fareAmount > 0 AND fareAmount < 100"
Filter the DataFrame to include only rows where fareAmount is a positive number that is less than 100.
filter(condition)[source]
Filters rows using the given condition.
where() is an alias for filter().
>>> df.filter(df.age > 3).collect() [Row(age=5, name=’Bob’)]
>>> df.where(df.age == 2).collect() [Row(age=2, name=’Alice’)]
>>> df.filter("age > 3").collect() [Row(age=5, name=’Bob’)]
>>> df.where("age = 2").collect() [Row(age=2, name=’Alice’)]
Incorrect:
*.where
Isin will not give the desired result.
Note: In Apache Spark, the where() function can be used to filter rows in a DataFrame based on a given condition. The condition is specified as a string that is evaluated for each row in the DataFrame. Rows for which the condition evaluates to True are retained, while those for which it evaluates to False are removed.
isin(*cols)[source]
A boolean expression that is evaluated to true if the value of this expression is contained by the evaluated values of the arguments.
>>> df[df.name.isin("Bob", "Mike")].collect() [Row(age=5, name=’Bob’)]
>>> df[df.age.isin([1, 2, 3])].collect() [Row(age=2, name=’Alice’)]
Reference: https://spark.apache.org/docs/2.3.0/api/python/pyspark.sql.html
HOTSPOT
You have a Fabric tenant that contains a lakehouse named Lakehouse1.
Lakehouse1 contains a table named Nyctaxi_raw. Nyctaxi_raw contains the following table:
You create a Fabric notebook and attach it to Lakehouse1.
You need to use PySpark code to transform the data.
The solution must meet the following requirements:
– Add a column named pickupDate that will contain only the date portion of pickupDateTime.
– Filter the DataFrame to include only rows where fareAmount is a positive number that is less than 100.
How should you complete the code? To answer, select the appropriate options in the answer area. NOTE: Each correct selection is worth one point.
Explanation:
Box 1: df.withColumnRenamed
Add a column named pickupDate that will contain only the date portion of pickupDateTime.
withColumnRenamed(existing, new)[source]
Returns a new DataFrame by renaming an existing column. This is a no-op if schema doesn’t contain the given column name.
Parameters:
existing C string, name of the existing column to rename.
col C string, new name of the column.
>>> df.withColumnRenamed(‘age’, ‘age2′).collect() [Row(age2=2, name=’Alice’), Row(age2=5, name=’Bob’)]
Incorrect:
* df.withColumn withColumn(colName, col)[source]
Returns a new DataFrame by adding a column or replacing the existing column that has the same name.
The column expression must be an expression over this DataFrame; attempting to add a column from some other dataframe will raise an error.
Parameters:
colName C string, name of the new column.
col C a Column expression for the new column.
>>> df.withColumn(‘age2’, df.age + 2).collect()
[Row(age=2, name=’Alice’, age2=4), Row(age=5, name=’Bob’, age2=7)]
Box 2: cast(‘date’)
cast(dataType)[source]
Convert the column into type dataType.
>>> df.select(df.age.cast("string").alias(‘ages’)).collect() [Row(ages=’2′), Row(ages=’5′)]
>>> df.select(df.age.cast(StringType()).alias(‘ages’)).collect() [Row(ages=’2′), Row(ages=’5′)]
Box 3: .filter("fareAmount > 0 AND fareAmount < 100"
Filter the DataFrame to include only rows where fareAmount is a positive number that is less than 100.
filter(condition)[source]
Filters rows using the given condition.
where() is an alias for filter().
>>> df.filter(df.age > 3).collect() [Row(age=5, name=’Bob’)]
>>> df.where(df.age == 2).collect() [Row(age=2, name=’Alice’)]
>>> df.filter("age > 3").collect() [Row(age=5, name=’Bob’)]
>>> df.where("age = 2").collect() [Row(age=2, name=’Alice’)]
Incorrect:
*.where
Isin will not give the desired result.
Note: In Apache Spark, the where() function can be used to filter rows in a DataFrame based on a given condition. The condition is specified as a string that is evaluated for each row in the DataFrame. Rows for which the condition evaluates to True are retained, while those for which it evaluates to False are removed.
isin(*cols)[source]
A boolean expression that is evaluated to true if the value of this expression is contained by the evaluated values of the arguments.
>>> df[df.name.isin("Bob", "Mike")].collect() [Row(age=5, name=’Bob’)]
>>> df[df.age.isin([1, 2, 3])].collect() [Row(age=2, name=’Alice’)]
Reference: https://spark.apache.org/docs/2.3.0/api/python/pyspark.sql.html
HOTSPOT
You have a Fabric tenant that contains a lakehouse named Lakehouse1.
Lakehouse1 contains a table named Nyctaxi_raw. Nyctaxi_raw contains the following table:
You create a Fabric notebook and attach it to Lakehouse1.
You need to use PySpark code to transform the data.
The solution must meet the following requirements:
– Add a column named pickupDate that will contain only the date portion of pickupDateTime.
– Filter the DataFrame to include only rows where fareAmount is a positive number that is less than 100.
How should you complete the code? To answer, select the appropriate options in the answer area. NOTE: Each correct selection is worth one point.
Explanation:
Box 1: df.withColumnRenamed
Add a column named pickupDate that will contain only the date portion of pickupDateTime.
withColumnRenamed(existing, new)[source]
Returns a new DataFrame by renaming an existing column. This is a no-op if schema doesn’t contain the given column name.
Parameters:
existing C string, name of the existing column to rename.
col C string, new name of the column.
>>> df.withColumnRenamed(‘age’, ‘age2′).collect() [Row(age2=2, name=’Alice’), Row(age2=5, name=’Bob’)]
Incorrect:
* df.withColumn withColumn(colName, col)[source]
Returns a new DataFrame by adding a column or replacing the existing column that has the same name.
The column expression must be an expression over this DataFrame; attempting to add a column from some other dataframe will raise an error.
Parameters:
colName C string, name of the new column.
col C a Column expression for the new column.
>>> df.withColumn(‘age2’, df.age + 2).collect()
[Row(age=2, name=’Alice’, age2=4), Row(age=5, name=’Bob’, age2=7)]
Box 2: cast(‘date’)
cast(dataType)[source]
Convert the column into type dataType.
>>> df.select(df.age.cast("string").alias(‘ages’)).collect() [Row(ages=’2′), Row(ages=’5′)]
>>> df.select(df.age.cast(StringType()).alias(‘ages’)).collect() [Row(ages=’2′), Row(ages=’5′)]
Box 3: .filter("fareAmount > 0 AND fareAmount < 100"
Filter the DataFrame to include only rows where fareAmount is a positive number that is less than 100.
filter(condition)[source]
Filters rows using the given condition.
where() is an alias for filter().
>>> df.filter(df.age > 3).collect() [Row(age=5, name=’Bob’)]
>>> df.where(df.age == 2).collect() [Row(age=2, name=’Alice’)]
>>> df.filter("age > 3").collect() [Row(age=5, name=’Bob’)]
>>> df.where("age = 2").collect() [Row(age=2, name=’Alice’)]
Incorrect:
*.where
Isin will not give the desired result.
Note: In Apache Spark, the where() function can be used to filter rows in a DataFrame based on a given condition. The condition is specified as a string that is evaluated for each row in the DataFrame. Rows for which the condition evaluates to True are retained, while those for which it evaluates to False are removed.
isin(*cols)[source]
A boolean expression that is evaluated to true if the value of this expression is contained by the evaluated values of the arguments.
>>> df[df.name.isin("Bob", "Mike")].collect() [Row(age=5, name=’Bob’)]
>>> df[df.age.isin([1, 2, 3])].collect() [Row(age=2, name=’Alice’)]
Reference: https://spark.apache.org/docs/2.3.0/api/python/pyspark.sql.html
HOTSPOT
You have a Fabric tenant that contains a lakehouse named Lakehouse1.
Lakehouse1 contains a table named Nyctaxi_raw. Nyctaxi_raw contains the following table:
You create a Fabric notebook and attach it to Lakehouse1.
You need to use PySpark code to transform the data.
The solution must meet the following requirements:
– Add a column named pickupDate that will contain only the date portion of pickupDateTime.
– Filter the DataFrame to include only rows where fareAmount is a positive number that is less than 100.
How should you complete the code? To answer, select the appropriate options in the answer area. NOTE: Each correct selection is worth one point.
Explanation:
Box 1: df.withColumnRenamed
Add a column named pickupDate that will contain only the date portion of pickupDateTime.
withColumnRenamed(existing, new)[source]
Returns a new DataFrame by renaming an existing column. This is a no-op if schema doesn’t contain the given column name.
Parameters:
existing C string, name of the existing column to rename.
col C string, new name of the column.
>>> df.withColumnRenamed(‘age’, ‘age2′).collect() [Row(age2=2, name=’Alice’), Row(age2=5, name=’Bob’)]
Incorrect:
* df.withColumn withColumn(colName, col)[source]
Returns a new DataFrame by adding a column or replacing the existing column that has the same name.
The column expression must be an expression over this DataFrame; attempting to add a column from some other dataframe will raise an error.
Parameters:
colName C string, name of the new column.
col C a Column expression for the new column.
>>> df.withColumn(‘age2’, df.age + 2).collect()
[Row(age=2, name=’Alice’, age2=4), Row(age=5, name=’Bob’, age2=7)]
Box 2: cast(‘date’)
cast(dataType)[source]
Convert the column into type dataType.
>>> df.select(df.age.cast("string").alias(‘ages’)).collect() [Row(ages=’2′), Row(ages=’5′)]
>>> df.select(df.age.cast(StringType()).alias(‘ages’)).collect() [Row(ages=’2′), Row(ages=’5′)]
Box 3: .filter("fareAmount > 0 AND fareAmount < 100"
Filter the DataFrame to include only rows where fareAmount is a positive number that is less than 100.
filter(condition)[source]
Filters rows using the given condition.
where() is an alias for filter().
>>> df.filter(df.age > 3).collect() [Row(age=5, name=’Bob’)]
>>> df.where(df.age == 2).collect() [Row(age=2, name=’Alice’)]
>>> df.filter("age > 3").collect() [Row(age=5, name=’Bob’)]
>>> df.where("age = 2").collect() [Row(age=2, name=’Alice’)]
Incorrect:
*.where
Isin will not give the desired result.
Note: In Apache Spark, the where() function can be used to filter rows in a DataFrame based on a given condition. The condition is specified as a string that is evaluated for each row in the DataFrame. Rows for which the condition evaluates to True are retained, while those for which it evaluates to False are removed.
isin(*cols)[source]
A boolean expression that is evaluated to true if the value of this expression is contained by the evaluated values of the arguments.
>>> df[df.name.isin("Bob", "Mike")].collect() [Row(age=5, name=’Bob’)]
>>> df[df.age.isin([1, 2, 3])].collect() [Row(age=2, name=’Alice’)]
Reference: https://spark.apache.org/docs/2.3.0/api/python/pyspark.sql.html
HOTSPOT
You have a Fabric tenant that contains a lakehouse named Lakehouse1.
Lakehouse1 contains a table named Nyctaxi_raw. Nyctaxi_raw contains the following table:
You create a Fabric notebook and attach it to Lakehouse1.
You need to use PySpark code to transform the data.
The solution must meet the following requirements:
– Add a column named pickupDate that will contain only the date portion of pickupDateTime.
– Filter the DataFrame to include only rows where fareAmount is a positive number that is less than 100.
How should you complete the code? To answer, select the appropriate options in the answer area. NOTE: Each correct selection is worth one point.
Explanation:
Box 1: df.withColumnRenamed
Add a column named pickupDate that will contain only the date portion of pickupDateTime.
withColumnRenamed(existing, new)[source]
Returns a new DataFrame by renaming an existing column. This is a no-op if schema doesn’t contain the given column name.
Parameters:
existing C string, name of the existing column to rename.
col C string, new name of the column.
>>> df.withColumnRenamed(‘age’, ‘age2′).collect() [Row(age2=2, name=’Alice’), Row(age2=5, name=’Bob’)]
Incorrect:
* df.withColumn withColumn(colName, col)[source]
Returns a new DataFrame by adding a column or replacing the existing column that has the same name.
The column expression must be an expression over this DataFrame; attempting to add a column from some other dataframe will raise an error.
Parameters:
colName C string, name of the new column.
col C a Column expression for the new column.
>>> df.withColumn(‘age2’, df.age + 2).collect()
[Row(age=2, name=’Alice’, age2=4), Row(age=5, name=’Bob’, age2=7)]
Box 2: cast(‘date’)
cast(dataType)[source]
Convert the column into type dataType.
>>> df.select(df.age.cast("string").alias(‘ages’)).collect() [Row(ages=’2′), Row(ages=’5′)]
>>> df.select(df.age.cast(StringType()).alias(‘ages’)).collect() [Row(ages=’2′), Row(ages=’5′)]
Box 3: .filter("fareAmount > 0 AND fareAmount < 100"
Filter the DataFrame to include only rows where fareAmount is a positive number that is less than 100.
filter(condition)[source]
Filters rows using the given condition.
where() is an alias for filter().
>>> df.filter(df.age > 3).collect() [Row(age=5, name=’Bob’)]
>>> df.where(df.age == 2).collect() [Row(age=2, name=’Alice’)]
>>> df.filter("age > 3").collect() [Row(age=5, name=’Bob’)]
>>> df.where("age = 2").collect() [Row(age=2, name=’Alice’)]
Incorrect:
*.where
Isin will not give the desired result.
Note: In Apache Spark, the where() function can be used to filter rows in a DataFrame based on a given condition. The condition is specified as a string that is evaluated for each row in the DataFrame. Rows for which the condition evaluates to True are retained, while those for which it evaluates to False are removed.
isin(*cols)[source]
A boolean expression that is evaluated to true if the value of this expression is contained by the evaluated values of the arguments.
>>> df[df.name.isin("Bob", "Mike")].collect() [Row(age=5, name=’Bob’)]
>>> df[df.age.isin([1, 2, 3])].collect() [Row(age=2, name=’Alice’)]
Reference: https://spark.apache.org/docs/2.3.0/api/python/pyspark.sql.html
Implement and manage semantic models
Testlet 1
Case study
This is a case study. Case studies are not timed separately. You can use as much exam time as you would like to complete each case. However, there may be additional case studies and sections on this exam. You must manage your time to ensure that you are able to complete all questions included on this exam in the time provided.
To answer the questions included in a case study, you will need to reference information that is provided in the case study. Case studies might contain exhibits and other resources that provide more information about the scenario that is described in the case study. Each question is independent of the other questions in this case study.
At the end of this case study, a review screen will appear. This screen allows you to review your answers and to make changes before you move to the next section of the exam. After you begin a new section, you cannot return to this section.
To start the case study
To display the first question in this case study, click the Next button. Use the buttons in the left pane to explore the content of the case study before you answer the questions. Clicking these buttons displays information such as business requirements, existing environment, and problem statements. If the case study has an All Information tab, note that the information displayed is identical to the information displayed on the subsequent tabs. When you are ready to answer a question, click the Question button to return to the question.
Overview
Litware, Inc. is a manufacturing company that has offices throughout North America. The analytics team at Litware contains data engineers, analytics engineers, data analysts, and data scientists.
Existing Environment
Fabric Environment
Litware has been using a Microsoft Power BI tenant for three years. Litware has NOT enabled any Fabric capacities and features.
Available Data
Litware has data that must be analyzed as shown in the following table.
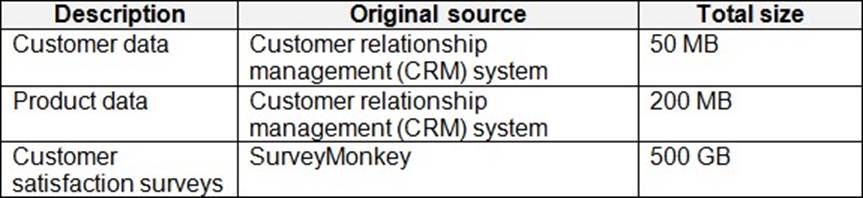
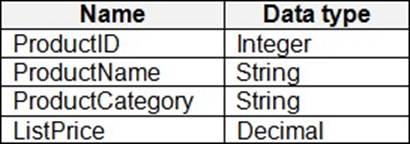
The Product data contains a single table and the following columns.
The customer satisfaction data contains the following tables:
– Survey
– Question
– Response
For each survey submitted, the following occurs:
– One row is added to the Survey table.
– One row is added to the Response table for each question in the survey.
The Question table contains the text of each survey question. The third question in each survey response is an overall satisfaction score. Customers can submit a survey after each purchase.
User Problems
The analytics team has large volumes of data, some of which is semi-structured. The team wants to use Fabric to create a new data store.
Product data is often classified into three pricing groups: high, medium, and low. This logic is implemented in several databases and semantic models, but the logic does NOT always match across implementations.
Requirements
Planned Changes
Litware plans to enable Fabric features in the existing tenant. The analytics team will create a new data store as a proof of concept (PoC). The remaining Litware users will only get access to the Fabric features once the PoC is complete. The PoC will be completed by using a Fabric trial capacity.
The following three workspaces will be created:
– AnalyticsPOC: Will contain the data store, semantic models, reports pipelines, dataflow, and notebooks used to populate the data store
– DataEngPOC: Will contain all the pipelines, dataflows, and notebooks used to populate OneLake
– DataSciPOC: Will contain all the notebooks and reports created by the data scientists
The following will be created in the AnalyticsPOC workspace:
– A data store (type to be decided)
– A custom semantic model
– A default semantic model
– Interactive reports
The data engineers will create data pipelines to load data to OneLake either hourly or daily depending on the data source. The analytics engineers will create processes to ingest, transform, and load the data to the data store in the AnalyticsPOC workspace daily. Whenever possible, the data engineers will use low-code tools for data ingestion. The choice of which data cleansing and transformation tools to use will be at the data engineers’ discretion.
All the semantic models and reports in the Analytics POC workspace will use the data store as the sole data source.
Technical Requirements
The data store must support the following:
– Read access by using T-SQL or Python
– Semi-structured and unstructured data
– Row-level security (RLS) for users executing T-SQL queries
Files loaded by the data engineers to OneLake will be stored in the Parquet format and will meet Delta Lake specifications.
Data will be loaded without transformation in one area of the AnalyticsPOC data store. The data will then be cleansed, merged, and transformed into a dimensional model.
The data load process must ensure that the raw and cleansed data is updated completely before populating the dimensional model.
The dimensional model must contain a date dimension. There is no existing data source for the date dimension. The Litware fiscal year matches the calendar year. The date dimension must always contain dates from 2010 through the end of the current year.
The product pricing group logic must be maintained by the analytics engineers in a single location. The pricing group data must be made available in the data store for T-SQL queries and in the default semantic model.
The following logic must be used:
– List prices that are less than or equal to 50 are in the low pricing group.
– List prices that are greater than 50 and less than or equal to 1,000 are in the medium pricing group.
– List prices that are greater than 1,000 are in the high pricing group.
Security Requirements
Only Fabric administrators and the analytics team must be able to see the Fabric items created as part of the PoC.
Litware identifies the following security requirements for the Fabric items in the AnalyticsPOC workspace:
– Fabric administrators will be the workspace administrators.
– The data engineers must be able to read from and write to the data store. No access must be granted to datasets or reports.
– The analytics engineers must be able to read from, write to, and create schemas in the data store. They also must be able to create and share semantic models with the data analysts and view and modify all reports in the workspace.
– The data scientists must be able to read from the data store, but not write to it. They will access the data by using a Spark notebook.
– The data analysts must have read access to only the dimensional model objects in the data store. They also must have access to create Power BI reports by using the semantic models created by the analytics engineers.
– The date dimension must be available to all users of the data store.
– The principle of least privilege must be followed.
Both the default and custom semantic models must include only tables or views from the dimensional model in the data store.
Litware already has the following Microsoft Entra security groups:
– FabricAdmins: Fabric administrators
– AnalyticsTeam: All the members of the analytics team
– DataAnalysts: The data analysts on the analytics team
– DataScientists: The data scientists on the analytics team
– DataEngineers: The data engineers on the analytics team
– AnalyticsEngineers: The analytics engineers on the analytics team
Report Requirements
The data analysts must create a customer satisfaction report that meets the following requirements:
– Enables a user to select a product to filter customer survey responses to only those who have purchased that product.
– Displays the average overall satisfaction score of all the surveys submitted during the last 12 months up to a selected date.
– Shows data as soon as the data is updated in the data store.
– Ensures that the report and the semantic model only contain data from the current and previous year.
– Ensures that the report respects any table-level security specified in the source data store.
– Minimizes the execution time of report queries.
HOTSPOT
You need to create a DAX measure to calculate the average overall satisfaction score.
How should you complete the DAX code? To answer, select the appropriate options in the answer area. NOTE: Each correct selection is worth one point.
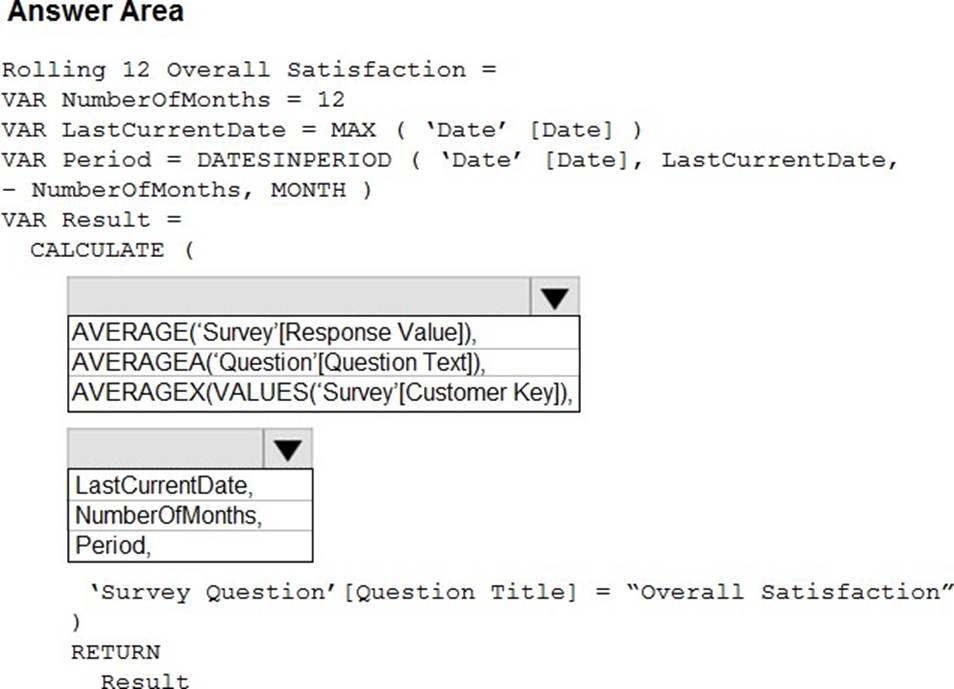
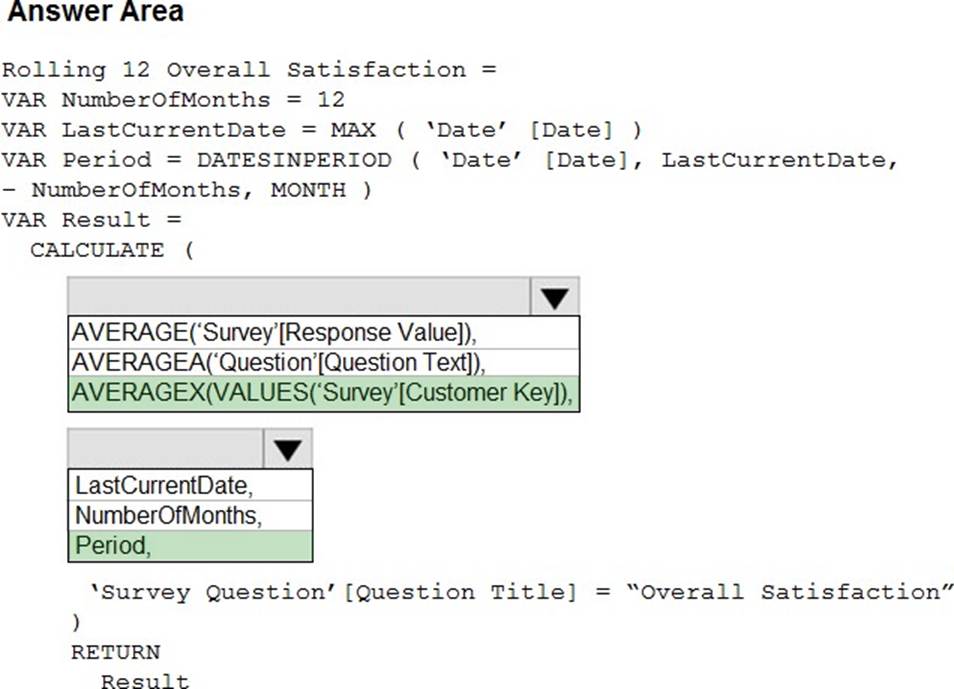
Explanation:
Box 1: AVERAGEX
AVERAGEX: Calculates the average (arithmetic mean) of a set of expressions evaluated over a table.
Syntax: AVERAGEX(<table>, <expression>)
The AVERAGEX function enables you to evaluate expressions for each row of a table, and then take the resulting set of values and calculate its arithmetic mean. Therefore, the function takes a table as its first argument, and an expression as the second argument.
Example
The following example calculates the average freight and tax on each order in the InternetSales table, by first summing Freight plus TaxAmt in each row, and then averaging those sums.
= AVERAGEX (InternetSales, InternetSales[Freight]+ InternetSales[TaxAmt])
Incorrect:
* AVERAGE
AVERAGE: Returns the average (arithmetic mean) of all the numbers in a column.
AVERAGE(<column>)
* AVERAGEA
AVERAGEA: Returns the average (arithmetic mean) of the values in a column.
AVERAGEA(<column>)
Box 2: PERIOD
DATESINPERIOD
Returns a table that contains a column of dates that begins with a specified start date and continues for the specified number and type of date intervals.
This function is suited to pass as a filter to the CALCULATE function. Use it to filter an expression by standard date intervals such as days, months, quarters, or years.
Note: VALUES
When the input parameter is a column name, returns a one-column table that contains the distinct values from the specified column. Duplicate values are removed and only unique values are returned. A BLANK value can be added. When the input parameter is a table name, returns the rows from the specified table. Duplicate rows are preserved. A BLANK row can be added.
Syntax
VALUES(<TableNameOrColumnName>)
Parameters
TableName or ColumnName
A column from which unique values are to be returned, or a table from which rows are to be returned.
Scenario:
For each survey submitted, the following occurs:
One row is added to the Survey table.
One row is added to the Response table for each question in the survey.
The Question table contains the text of each survey question. The third question in each survey response is an overall satisfaction score. Customers can submit a survey after each purchase.
Reference:
https://learn.microsoft.com/en-us/dax/averagex-function-dax
https://learn.microsoft.com/en-us/dax/datesinperiod-function-dax
https://learn.microsoft.com/en-us/dax/values-function-dax
You plan to deploy Microsoft Power BI items by using Fabric deployment pipelines. You have a deployment pipeline that contains three stages named Development, Test, and Production. A workspace is assigned to each stage.
You need to provide Power BI developers with access to the pipeline.
The solution must meet the following requirements:
– Ensure that the developers can deploy items to the workspaces for Development and Test.
– Prevent the developers from deploying items to the workspace for Production.
– Ensure that the developers can view items in Production.
– Follow the principle of least privilege.
Which three levels of access should you assign to the developers? Each correct answer presents part of the solution. NOTE: Each correct answer is worth one point.
- A . Build permission to the production semantic models
- B . Admin access to the deployment pipeline
- C . Viewer access to the Development and Test workspaces
- D . Viewer access to the Production workspace
- E . Contributor access to the Development and Test workspaces
- F . Contributor access to the Production workspace