
CertNexus AIP-210 Practice Exams
Last updated on Oct 22,2026- Exam Code: AIP-210
- Exam Name: CertNexus Certified Artificial Intelligence Practitioner (CAIP)
- Certification Provider: CertNexus
- Latest update: Oct 22,2026
Which of the following describes a neural network without an activation function?
- A . A form of a linear regression
- B . A form of a quantile regression
- C . An unsupervised learning technique
- D . A radial basis function kernel
A
Explanation:
A neural network without an activation function is equivalent to a form of a linear regression. A neural network is a computational model that consists of layers of interconnected nodes (neurons) that process inputs and produce outputs. An activation function is a function that determines the output of a neuron based on its input. An activation function can introduce non-linearity into a neural network, which allows it to model complex and non-linear relationships between inputs and outputs. Without an activation function, a neural network becomes a linear combination of inputs and weights, which is essentially a linear regression model.
Your dependent variable data is a proportion. The observed range of your data is 0.01 to 0.99. The instrument used to generate the dependent variable data is known to generate low quality data for values close to 0 and close to 1. A colleague suggests performing a logit-transformation on the data prior to performing a linear regression.
Which of the following is a concern with this approach? Definition of logit-transformation
If p is the proportion: logit(p)=log(p/(l-p))
- A . After logit-transformation, the data may violate the assumption of independence.
- B . Noisy data could become more influential in your model.
- C . The model will be more likely to violate the assumption of normality.
- D . Values near 0.5 before logit-transformation will be near 0 after.
B
Explanation:
Logit-transformation is a common way to transform proportion data into a continuous variable that can be used for linear regression. However, one concern with this approach is that noisy data could become more influential in your model. This is because logit-transformation tends to amplify the values close to 0 and 1, which are also the values that are likely to be affected by measurement errors or outliers. This could distort the relationship between the dependent and independent variables and bias the regression coefficients.
Reference: [Logit Transformation | Real Statistics Using Excel], [Logit transformation for proportions – Cross Validated]
Which of the following is TRUE about SVM models?
- A . They can be used only for classification.
- B . They can be used only for regression.
- C . They can take the feature space into higher dimensions to solve the problem.
- D . They use the sigmoid function to classify the data points.
C
Explanation:
SVM models can use kernel functions to map the input data into higher-dimensional feature spaces, where linear separation is possible. This allows SVM models to handle non-linear problems effectively.
Reference: CertNexus Certified Artificial Intelligence Practitioner, Support vector machine – Wikipedia
R-squared is a statistical measure that:
- A . Combines precision and recall of a classifier into a single metric by taking their harmonic mean.
- B . Expresses the extent to which two variables are linearly related.
- C . Is the proportion of the variance for a dependent variable thaf’ s explained by independent variables.
- D . Represents the extent to which two random variables vary together.
C
Explanation:
R-squared is a statistical measure that indicates how well a regression model fits the data. R-squared is calculated by dividing the explained variance by the total variance. The explained variance is the amount of variation in the dependent variable that can be attributed to the independent variables. The total variance is the amount of variation in the dependent variable that can be observed in the data. R-squared ranges from 0 to 1, where 0 means no fit and 1 means perfect fit.
The graph is an elbow plot showing the inertia or within-cluster sum of squares on the y-axis and number of clusters (also called K) on the x-axis, denoting the change in inertia as the clusters change using k-means algorithm.
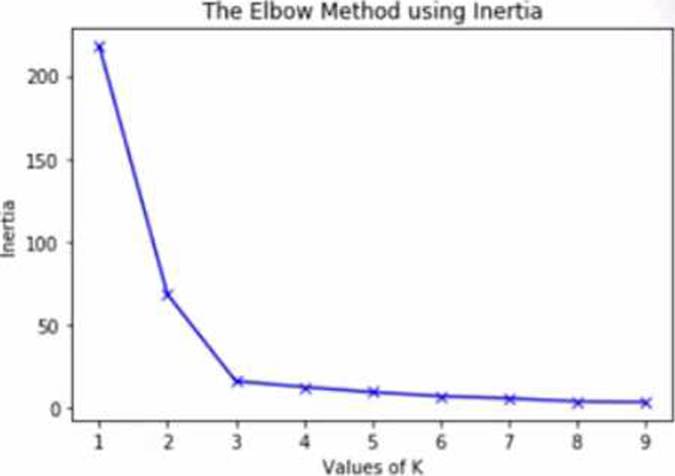
What would be an optimal value of K to ensure a good number of clusters?
- A . 2
- B . 3
- C . 5
- D . 9
B
Explanation:
The optimal value of K is the one that minimizes the inertia or within-cluster sum of squares, while avoiding too many clusters that may overfit the data. The elbow plot shows a sharp decrease in inertia from K = 1 to K = 2, and then a more gradual decrease from K = 2 to K = 3. After K = 3, the inertia does not change much as K increases. Therefore, the elbow point is at K = 3, which is the optimal value of K for this data.
Reference: How to Run K-Means Clustering in Python, K-means clustering – Wikipedia
Why do data skews happen in the ML pipeline?
- A . Test and evaluation data are designed incorrectly.
- B . There Is a mismatch between live input data and offline data.
- C . There is a mismatch between live output data and offline data.
- D . There is insufficient training data for evaluation.
B
Explanation:
Data skews happen in the ML pipeline when the distribution or characteristics of the live input data differ from those of the offline data used for training and testing the model. This can lead to a degradation of the model performance and accuracy, as the model is not able to generalize well to new data. Data skews can be caused by various factors, such as changes in user behavior, data collection methods, data quality issues, or external events
Reference: What is training-serving skew in Machine Learning?, Data preprocessing for ML: options and recommendations
Which of the following is NOT an activation function?
- A . Additive
- B . Hyperbolic tangent
- C . ReLU
- D . Sigmoid
A
Explanation:
An activation function is a function that determines the output of a neuron in a neural network based on its input. An activation function can introduce non-linearity into a neural network, which allows it to model complex and non-linear relationships between inputs and outputs.
Some of the common activation functions are:
Sigmoid: A sigmoid function is a function that maps any real value to a value between 0 and 1. It has an S-shaped curve and is often used for binary classification or probability estimation.
Hyperbolic tangent: A hyperbolic tangent function is a function that maps any real value to a value between -1 and 1. It has a similar shape to the sigmoid function but is symmetric around the origin. It is often used for regression or classification problems.
ReLU: A ReLU (rectified linear unit) function is a function that maps any negative value to 0 and any positive value to itself. It has a piecewise linear shape and is often used for hidden layers in deep neural networks.
Additive is not an activation function, but rather a term that describes a property of some functions. Additive functions are functions that satisfy the condition f(x+y) = f(x) + f(y) for any x and y. Additive functions are linear functions, which means they have a constant slope and do not introduce non-linearity.
What is the primary benefit of the Federated Learning approach to machine learning?
- A . It does not require a labeled dataset to solve supervised learning problems.
- B . It protects the privacy of the user’s data while providing well-trained models.
- C . It requires less computation to train the same model using a traditional approach.
- D . It uses large, centralized data stores to train complex machine learning models.
B
Explanation:
Federated learning is a distributed approach to machine learning that allows multiple parties to collaboratively train a model without sharing their data with each other or a central server. This protects the privacy of the user’s data while still enabling well-trained models that can benefit from diverse and large-scale datasets.
Reference: [Federated Learning – Wikipedia], [Federated Learning for Mobile Keyboard Prediction – Google AI Blog]
Which of the following can benefit from deploying a deep learning model as an embedded model on edge devices?
- A . A more complex model
- B . Guaranteed availability of enough space
- C . Increase in data bandwidth consumption
- D . Reduction in latency
D
Explanation:
Latency is the time delay between a request and a response. Latency can affect the performance and user experience of an application, especially when real-time or near-real-time responses are required. Deploying a deep learning model as an embedded model on edge devices can reduce latency, as the model can run locally on the device without relying on network connectivity or cloud servers. Edge devices are devices that are located at the edge of a network, such as smartphones, tablets, laptops, sensors, cameras, or drones.
Which of the following regressions will help when there is the existence of near-linear relationships among the independent variables (collinearity)?
- A . Clustering
- B . Linear regression
- C . Polynomial regression
- D . Ridge regression
D
Explanation:
Ridge regression is a type of regularization technique that can help reduce collinearity among independent variables. It does this by adding a penalty term to the ordinary least squares (OLS) objective function, which shrinks the coefficients of highly correlated variables towards zero. This reduces the variance of the coefficient estimates and improves the stability and accuracy of the regression model.
Reference: Multicollinearity in Regression Analysis: Problems, Detection, and Solutions – Statistics By Jim, A Beginner’s Guide to Collinearity: What it is and How it affects our regression model – StrataScratch