
Amazon MLS-C01 Practice Exams
Last updated on Oct 22,2026- Exam Code: MLS-C01
- Exam Name: AWS Certified Machine Learning - Specialty
- Certification Provider: Amazon
- Latest update: Oct 22,2026
A company is converting a large number of unstructured paper receipts into images. The company wants to create a model based on natural language processing (NLP) to find relevant entities such as date, location, and notes, as well as some custom entities such as receipt numbers.
The company is using optical character recognition (OCR) to extract text for data labeling. However, documents are in different structures and formats, and the company is facing challenges with setting up the manual workflows for each document type. Additionally, the company trained a named entity recognition (NER) model for custom entity detection using a small sample size. This model has a very low confidence score and will require retraining with a large dataset.
Which solution for text extraction and entity detection will require the LEAST amount of effort?
- A . Extract text from receipt images by using Amazon Textract. Use the Amazon SageMaker BlazingText algorithm to train on the text for entities and custom entities.
- B . Extract text from receipt images by using a deep learning OCR model from the AWS Marketplace.
Use the NER deep learning model to extract entities. - C . Extract text from receipt images by using Amazon Textract. Use Amazon Comprehend for entity detection, and use Amazon Comprehend custom entity recognition for custom entity detection.
- D . Extract text from receipt images by using a deep learning OCR model from the AWS Marketplace. Use Amazon Comprehend for entity detection, and use Amazon Comprehend custom entity recognition for custom entity detection.
C
Explanation:
The best solution for text extraction and entity detection with the least amount of effort is to use Amazon Textract and Amazon Comprehend.
These services are:
Amazon Textract for text extraction from receipt images. Amazon Textract is a machine learning service that can automatically extract text and data from scanned documents. It can handle different structures and formats of documents, such as PDF, TIFF, PNG, and JPEG, without any preprocessing steps. It can also extract key-value pairs and tables from documents1
Amazon Comprehend for entity detection and custom entity detection. Amazon Comprehend is a natural language processing service that can identify entities, such as dates, locations, and notes, from unstructured text. It can also detect custom entities, such as receipt numbers, by using a custom entity recognizer that can be trained with a small amount of labeled data2
The other options are not suitable because they either require more effort for text extraction, entity detection, or custom entity detection. For example:
Option A uses the Amazon SageMaker BlazingText algorithm to train on the text for entities and custom entities. BlazingText is a supervised learning algorithm that can perform text classification and word2vec. It requires users to provide a large amount of labeled data, preprocess the data into a specific format, and tune the hyperparameters of the model3
Option B uses a deep learning OCR model from the AWS Marketplace and a NER deep learning model for text extraction and entity detection. These models are pre-trained and may not be suitable for the specific use case of receipt processing. They also require users to deploy and manage the models on Amazon SageMaker or Amazon EC2 instances4
Option D uses a deep learning OCR model from the AWS Marketplace for text extraction. This model has the same drawbacks as option B. It also requires users to integrate the model output with Amazon Comprehend for entity detection and custom entity detection.
Reference:
1: Amazon Textract C Extract text and data from documents
2: Amazon Comprehend C Natural Language Processing (NLP) and Machine Learning (ML)
3: BlazingText – Amazon SageMaker
4: AWS Marketplace: OCR
A bank has collected customer data for 10 years in CSV format. The bank stores the data in an on-premises server. A data science team wants to use Amazon SageMaker to build and train a machine learning (ML) model to predict churn probability. The team will use the historical data. The data scientists want to perform data transformations quickly and to generate data insights before the team builds a model for production.
Which solution will meet these requirements with the LEAST development effort?
- A . Upload the data into the SageMaker Data Wrangler console directly. Perform data transformations and generate insights within Data Wrangler.
- B . Upload the data into an Amazon S3 bucket. Allow SageMaker to access the data that is in the bucket. Import the data from the S3 bucket into SageMaker Data Wrangler. Perform data transformations and generate insights within Data Wrangler.
- C . Upload the data into the SageMaker Data Wrangler console directly. Allow SageMaker and Amazon QuickSight to access the data that is in an Amazon S3 bucket. Perform data transformations in Data Wrangler and save the transformed data into a second S3 bucket. Use QuickSight to generate data insights.
- D . Upload the data into an Amazon S3 bucket. Allow SageMaker to access the data that is in the bucket. Import the data from the bucket into SageMaker Data Wrangler. Perform data transformations in Data Wrangler. Save the data into a second S3 bucket. Use a SageMaker Studio notebook to generate data insights.
B
Explanation:
To prepare and transform historical data efficiently with minimal setup, Amazon SageMaker Data Wrangler is the optimal tool. Data Wrangler simplifies data preprocessing and exploratory data analysis (EDA) by providing a graphical interface for transformations and insights. By first uploading the CSV data to Amazon S3, the data becomes easily accessible to SageMaker and can be imported directly into Data Wrangler.
Once in Data Wrangler, the team can perform required data transformations and generate insights in a single workflow, avoiding the need for additional tools like Amazon QuickSight or further notebook configuration. This approach provides the simplest and most integrated solution for the data science team.
A retail company wants to combine its customer orders with the product description data from its product catalog. The structure and format of the records in each dataset is different. A data analyst tried to use a spreadsheet to combine the datasets, but the effort resulted in duplicate records and records that were not properly combined. The company needs a solution that it can use to combine similar records from the two datasets and remove any duplicates.
Which solution will meet these requirements?
- A . Use an AWS Lambda function to process the data. Use two arrays to compare equal strings in the fields from the two datasets and remove any duplicates.
- B . Create AWS Glue crawlers for reading and populating the AWS Glue Data Catalog. Call the AWS Glue SearchTables API operation to perform a fuzzy-matching search on the two datasets, and cleanse the data accordingly.
- C . Create AWS Glue crawlers for reading and populating the AWS Glue Data Catalog. Use the FindMatches transform to cleanse the data.
- D . Create an AWS Lake Formation custom transform. Run a transformation for matching products from the Lake Formation console to cleanse the data automatically.
C
Explanation:
The FindMatches transform is a machine learning transform that can identify and match similar records from different datasets, even when the records do not have a common unique identifier or exact field values. The FindMatches transform can also remove duplicate records from a single dataset. The FindMatches transform can be used with AWS Glue crawlers and jobs to process the data from various sources and store it in a data lake. The FindMatches transform can be created and managed using the AWS Glue console, API, or AWS Glue Studio.
The other options are not suitable for this use case because:
Option A: Using an AWS Lambda function to process the data and compare equal strings in the fields from the two datasets is not an efficient or scalable solution. It would require writing custom code and handling the data loading and cleansing logic. It would also not account for variations or inconsistencies in the field values, such as spelling errors, abbreviations, or missing data.
Option B: The AWS Glue SearchTables API operation is used to search for tables in the AWS Glue Data Catalog based on a set of criteria. It is not a machine learning transform that can match records across different datasets or remove duplicates. It would also require writing custom code to invoke the API and process the results.
Option D: AWS Lake Formation does not provide a custom transform feature. It provides predefined blueprints for common data ingestion scenarios, such as database snapshot, incremental database, and log file. These blueprints do not support matching records across different datasets or removing duplicates.
A Machine Learning Specialist is deciding between building a naive Bayesian model or a full Bayesian network for a classification problem. The Specialist computes the Pearson correlation coefficients between each feature and finds that their absolute values range between 0.1 to 0.95.
Which model describes the underlying data in this situation?
- A . A naive Bayesian model, since the features are all conditionally independent.
- B . A full Bayesian network, since the features are all conditionally independent.
- C . A naive Bayesian model, since some of the features are statistically dependent.
- D . A full Bayesian network, since some of the features are statistically dependent.
D
Explanation:
A naive Bayesian model assumes that the features are conditionally independent given the class label. This means that the joint probability of the features and the class can be factorized as the product of the class prior and the feature likelihoods. A full Bayesian network, on the other hand, does not make this assumption and allows for modeling arbitrary dependencies between the features and the class using a directed acyclic graph. In this case, the joint probability of the features and the class is given by the product of the conditional probabilities of each node given its parents in the graph. If the features are statistically dependent, meaning that their correlation coefficients are not close to zero, then a naive Bayesian model would not capture these dependencies and would likely perform worse than a full Bayesian network that can account for them. Therefore, a full Bayesian network describes the underlying data better in this situation.
References:
Naive Bayes and Text Classification I
Bayesian Networks
A Data Scientist wants to gain real-time insights into a data stream of GZIP files.
Which solution would allow the use of SQL to query the stream with the LEAST latency?
- A . Amazon Kinesis Data Analytics with an AWS Lambda function to transform the data.
- B . AWS Glue with a custom ETL script to transform the data.
- C . An Amazon Kinesis Client Library to transform the data and save it to an Amazon ES cluster.
- D . Amazon Kinesis Data Firehose to transform the data and put it into an Amazon S3 bucket.
A
Explanation:
Amazon Kinesis Data Analytics is a service that enables you to analyze streaming data in real time using SQL or Apache Flink applications. You can use Kinesis Data Analytics to process and gain insights from data streams such as web logs, clickstreams, IoT data, and more.
To use SQL to query a data stream of GZIP files, you need to first transform the data into a format that Kinesis Data Analytics can understand, such as JSON, CSV, or Apache Parquet. You can use an AWS Lambda function to perform this transformation and send the output to a Kinesis data stream that is connected to your Kinesis Data Analytics application. This way, you can use SQL to query the stream with the least latency, as Lambda functions are triggered in near real time by the incoming data and Kinesis Data Analytics can process the data as soon as it arrives.
The other options are not optimal for this scenario, as they introduce more latency or complexity.
AWS Glue is a serverless data integration service that can perform ETL (extract, transform, and load)
tasks on data sources, but it is not designed for real-time streaming data analysis. An Amazon Kinesis Client Library is a Java library that enables you to build custom applications that process data from Kinesis data streams, but it requires more coding and configuration than using a Lambda function.
Amazon Kinesis Data Firehose is a service that can deliver streaming data to destinations such as Amazon S3, Amazon Redshift, Amazon OpenSearch Service, and Splunk, but it does not support SQL queries on the data.
References:
What Is Amazon Kinesis Data Analytics for SQL Applications? Using AWS Lambda with Amazon Kinesis Data Streams Using AWS Lambda with Amazon Kinesis Data Firehose
A global bank requires a solution to predict whether customers will leave the bank and choose another bank. The bank is using a dataset to train a model to predict customer loss. The training dataset has 1,000 rows. The training dataset includes 100 instances of customers who left the bank.
A machine learning (ML) specialist is using Amazon SageMaker Data Wrangler to train a churn prediction model by using a SageMaker training job. After training, the ML specialist notices that the model returns only false results. The ML specialist must correct the model so that it returns more accurate predictions.
Which solution will meet these requirements?
- A . Apply anomaly detection to remove outliers from the training dataset before training.
- B . Apply Synthetic Minority Oversampling Technique (SMOTE) to the training dataset before training.
- C . Apply normalization to the features of the training dataset before training.
- D . Apply undersampling to the training dataset before training.
B
Explanation:
The SageMaker CreatePresignedDomainUrl API is the best option to meet the requirements of the company. This API creates a URL for a specified UserProfile in a Domain. When accessed in a web browser, the user will be automatically signed in to the domain, and granted access to all of the Apps and files associated with the Domain’s Amazon Elastic File System (EFS) volume. This API can only be called when the authentication mode equals IAM, which means the company can use its existing IdP to authenticate users. The company can use the DynamoDB table to store the domain IDs and user profile names for each department, and use the proxy application to query the table and generate the presigned URL for the appropriate domain according to the user’s credentials. The presigned URL is valid only for a specified duration, which can be set by the SessionExpirationDurationInSeconds parameter. This can help enhance the security and prevent unauthorized access to the domains.
The other options are not suitable for the company’s requirements. The SageMaker CreateHumanTaskUi API is used to define the settings for the human review workflow user interface, which is not related to accessing the SageMaker Studio domains. The SageMaker ListHumanTaskUis API is used to return information about the human task user interfaces in the account, which is also not relevant to the company’s use case. The SageMaker CreatePresignedNotebookInstanceUrl API is used to create a URL to connect to the Jupyter server from a notebook instance, which is different from accessing the SageMaker Studio domain.
References:
• CreatePresignedDomainUrl
• CreatePresignedNotebookInstanceUrl
• CreateHumanTaskUi
• ListHumanTaskUis
A company supplies wholesale clothing to thousands of retail stores. A data scientist must create a model that predicts the daily sales volume for each item for each store. The data scientist discovers that more than half of the stores have been in business for less than 6 months. Sales data is highly consistent from week to week. Daily data from the database has been aggregated weekly, and weeks with no sales are omitted from the current dataset. Five years (100 MB) of sales data is available in Amazon S3.
Which factors will adversely impact the performance of the forecast model to be developed, and which actions should the data scientist take to mitigate them? (Choose two.)
- A . Detecting seasonality for the majority of stores will be an issue. Request categorical data to relate new stores with similar stores that have more historical data.
- B . The sales data does not have enough variance. Request external sales data from other industries to improve the model’s ability to generalize.
- C . Sales data is aggregated by week. Request daily sales data from the source database to enable building a daily model.
- D . The sales data is missing zero entries for item sales. Request that item sales data from the source database include zero entries to enable building the model.
- E . Only 100 MB of sales data is available in Amazon S3. Request 10 years of sales data, which would provide 200 MB of training data for the model.
C,D
Explanation:
The factors that will adversely impact the performance of the forecast model are:
Sales data is aggregated by week. This will reduce the granularity and resolution of the data, and make it harder to capture the daily patterns and variations in sales volume. The data scientist should request daily sales data from the source database to enable building a daily model, which will be more accurate and useful for the prediction task.
Sales data is missing zero entries for item sales. This will introduce bias and incompleteness in the data, and make it difficult to account for the items that have no demand or are out of stock. The data scientist should request that item sales data from the source database include zero entries to enable building the model, which will be more robust and realistic.
The other options are not valid because:
Detecting seasonality for the majority of stores will not be an issue, as sales data is highly consistent from week to week. Requesting categorical data to relate new stores with similar stores that have more historical data may not improve the model performance significantly, and may introduce unnecessary complexity and noise.
The sales data does not need to have more variance, as it reflects the actual demand and behavior of the customers. Requesting external sales data from other industries will not improve the model’s ability to generalize, but may introduce irrelevant and misleading information.
Only 100 MB of sales data is not a problem, as it is sufficient to train a forecast model with Amazon S3 and Amazon Forecast. Requesting 10 years of sales data will not provide much benefit, as it may contain outdated and obsolete information that does not reflect the current market trends and customer preferences.
References:
Amazon Forecast
Forecasting: Principles and Practice
A manufacturing company has a large set of labeled historical sales data. The manufacturer would like to predict how many units of a particular part should be produced each quarter.
Which machine learning approach should be used to solve this problem?
- A . Logistic regression
- B . Random Cut Forest (RCF)
- C . Principal component analysis (PCA)
- D . Linear regression
D
Explanation:
Linear regression is a machine learning approach that can be used to solve this problem. Linear regression is a supervised learning technique that can model the relationship between one or more
input variables (features) and an output variable (target). In this case, the input variables could be the historical sales data of the part, such as the quarter, the demand, the price, the inventory, etc. The output variable could be the number of units to be produced for the part. Linear regression can learn the coefficients (weights) of the input variables that best fit the output variable, and then use them to make predictions for new data. Linear regression is suitable for problems that involve continuous and numeric output variables, such as predicting house prices, stock prices, or sales volumes.
References:
AWS Machine Learning Specialty Exam Guide
Linear Regression
A company wants to classify user behavior as either fraudulent or normal. Based on internal research, a Machine Learning Specialist would like to build a binary classifier based on two features: age of account and transaction month. The class distribution for these features is illustrated in the figure provided.
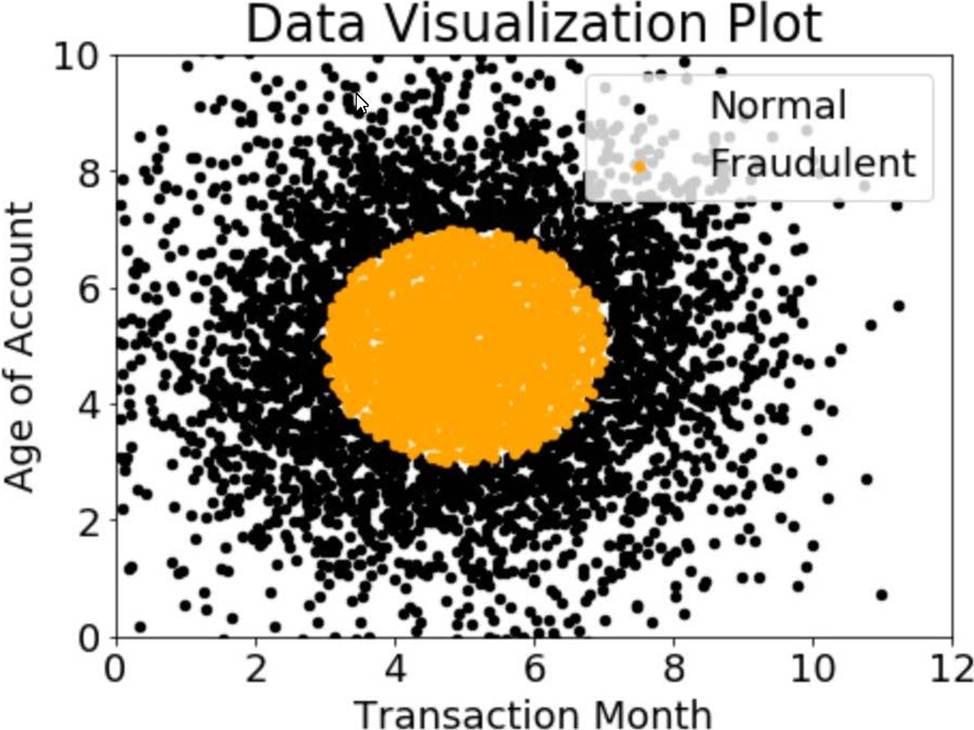
Based on this information which model would have the HIGHEST accuracy?
- A . Long short-term memory (LSTM) model with scaled exponential linear unit (SELL))
- B . Logistic regression
- C . Support vector machine (SVM) with non-linear kernel
- D . Single perceptron with tanh activation function
C
Explanation:
Based on the figure provided, the data is not linearly separable. Therefore, a non-linear model such as SVM with a non-linear kernel would be the best choice. SVMs are particularly effective in high-dimensional spaces and are versatile in that they can be used for both linear and non-linear data. Additionally, SVMs have a high level of accuracy and are less prone to overfitting1 References: 1: https://docs.aws.amazon.com/sagemaker/latest/dg/svm.html
A machine learning (ML) specialist at a retail company must build a system to forecast the daily sales for one of the company’s stores. The company provided the ML specialist with sales data for this store from the past 10 years. The historical dataset includes the total amount of sales on each day for the store. Approximately 10% of the days in the historical dataset are missing sales data.
The ML specialist builds a forecasting model based on the historical dataset. The specialist discovers that the model does not meet the performance standards that the company requires.
Which action will MOST likely improve the performance for the forecasting model?
- A . Aggregate sales from stores in the same geographic area.
- B . Apply smoothing to correct for seasonal variation.
- C . Change the forecast frequency from daily to weekly.
- D . Replace missing values in the dataset by using linear interpolation.
D
Explanation:
When forecasting sales data, missing values can significantly impact model accuracy, especially for time series models. Approximately 10% of the days in this dataset lack sales data, which may cause gaps in patterns and disrupt seasonal trends. Linear interpolation is an effective technique for estimating and filling in missing data points based on adjacent known values, thus preserving the continuity of the time series.
By interpolating the missing values, the ML specialist can provide the model with a more complete and consistent dataset, potentially enhancing performance. This approach maintains the daily data granularity, which is important for accurately capturing trends at that frequency.