
Splunk SPLK-2003 Practice Exams
Last updated on Oct 07,2026- Exam Code: SPLK-2003
- Exam Name: Splunk SOAR Certified Automation Developer Exam
- Certification Provider: Splunk
- Latest update: Oct 07,2026
When assigning an input parameter to an action while building a playbook, a user notices the artifact value they are looking for does not appear in the auto-populated list.
How is it possible to enter the unlisted artifact value?
- A . Type the CEF datapath in manually.
- B . Delete and recreate the artifact.
- C . Edit the artifact to enable the List as Parameter option for the CEF value.
- D . Edit the container to allow CEF parameters.
A
Explanation:
When building a playbook in Splunk SOAR, if the desired artifact value does not appear in the auto-populated list of input parameters for an action, users have the option to manually enter the Common Event Format (CEF) datapath for that value. This allows for greater flexibility and customization in playbook design, ensuring that specific data points can be targeted even if they’re not immediately visible in the interface. This manual entry of CEF datapaths allows users to directly reference the necessary data within artifacts, bypassing limitations of the auto-populated list. Options B, C, and D suggest alternative methods that are not typically used for this purpose, making option A the correct and most direct approach to entering an unlisted artifact value in a playbook action.
When assigning an input parameter to an action while building a playbook, a user can use the auto-populated list of artifact values that match the expected data type for the parameter. The auto-populated list is based on the contains parameter of the action inputs and outputs, which enables contextual actions in the SOAR user interface. However, the auto-populated list may not include all the possible artifact values that can be used as parameters, especially if the artifact values are nested or have uncommon data types. In that case, the user can type the CEF datapath in manually, using the syntax artifact.<field>.<key>, where field is the name of the artifact field, such as cef, and key is the name of the subfield within the artifact field, such as sourceAddress. Typing the CEF datapath in manually allows the user to enter the unlisted artifact value as an input parameter to the action. Therefore, option A is the correct answer, as it states how it is possible to enter the unlisted artifact value.
Option B is incorrect, because deleting and recreating the artifact is not a way to enter the unlisted artifact value, but rather a way to lose the existing artifact data.
Option C is incorrect, because editing the artifact to enable the List as Parameter option for the CEF value is not a way to enter the unlisted artifact value, but rather a way to make the artifact value appear in the auto-populated list.
Option D is incorrect, because editing the container to allow CEF parameters is not a way to enter the unlisted artifact value, but rather a way to modify the container properties, which are not related to the action parameters.
In this image, which container fields are searched for the text "Malware"?
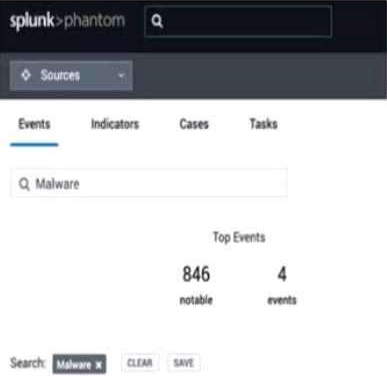
- A . Event Name and Artifact Names.
- B . Event Name, Notes, Comments.
- C . Event Name or ID.
A
Explanation:
The image shows a user interface of “splunk>phantom” with a search bar at the top, where a search for “Malware” has been initiated. The tabs labeled “Events,” “Indicators,” “Cases,” and “Tasks” suggest that the search functionality could span across various container fields within the Splunk SOAR environment. Typically, the search would include fields that are most relevant to the user’s query, which in this case, are likely to be the Event Name and Artifact Names. These fields are central to identifying and categorizing events and artifacts within Splunk SOAR, making them primary targets for a search term like “Malware” which is commonly associated with security events and indicators17.
Reference: Understanding containers – Splunk Documentation
What are indicators?
- A . Action result items that determine the flow of execution in a playbook.
- B . Action results that may appear in multiple containers.
- C . Artifact values that can appear in multiple containers.
- D . Artifact values with special security significance.
C
Explanation:
Indicators in Splunk SOAR (formerly Phantom) are crucial elements used to detect and respond to security incidents.
Let’s break down what indicators are and their significance:
Definition of Indicators:
Indicators are data points or patterns that suggest the presence of malicious activity or potential security threats.
They can be anything from IP addresses, domain names, file hashes, URLs, email addresses, or other observable artifacts.
Indicators help security teams identify and correlate events across different sources to understand the scope and impact of an incident.
Types of Indicators:
Observable Indicators: These are directly observable artifacts, such as IP addresses, domain names, or file hashes.
Behavioral Indicators: These describe patterns of behavior, such as failed login attempts, lateral movement, or suspicious network traffic.
Contextual Indicators: These provide additional context around an event, such as the user account associated with an action or the time of occurrence.
Use Cases for Indicators:
Threat Detection: Security analysts create rules or playbooks that trigger based on specific indicators.
For example, an indicator like a known malicious IP address can trigger an alert.
Incident Response: During an incident, indicators help identify affected systems, track lateral movement, and prioritize response efforts.
Threat Intelligence Sharing: Organizations share indicators with each other to improve collective security posture.
Multiple Containers:
Indicators can appear in multiple containers (playbooks, actions, etc.) within Splunk SOAR.
For example, an IP address associated with a suspicious domain might appear in both a threat intelligence playbook and an incident response playbook.
Artifact Values vs. Indicators:
While artifact values are related, they are not the same as indicators.
Artifact values represent specific data extracted from an artifact (e.g., extracting an IP address from an email header).
Indicators encompass a broader range of data points and are used for detection and correlation.
Reference: Splunk SOAR Documentation: Indicators
Splunk SOAR Community: Understanding Indicators
If no data matches any filter conditions, what is the next block run by the playbook?
- A . The end block.
- B . The start block.
- C . The filter block.
- D . The next block.
D
Explanation:
In a Splunk SOAR playbook, if no data matches the conditions specified within a filter block, the playbook execution will proceed to the next block that is configured to follow the filter block. The "next block" refers to whatever action or decision block is designed to be next in the sequence according to the playbook’s logic.
Filters in Splunk SOAR are used to make decisions based on data conditions, and they control the flow of the playbook. If the conditions in a filter block are not met, the playbook does not simply end or restart; rather, it continues to execute the subsequent blocks that have been set up to handle situations where the filter conditions are not met.
A filter block will typically have different paths for different outcomes―matching and non-matching. If the conditions are matched, one set of blocks will execute, and if not, another set of blocks, which could simply be the next one in the sequence, will execute. This allows for complex logic and branching within the playbook to handle a wide range of scenarios.
In a Splunk SOAR playbook, when no data matches any filter conditions, the playbook continues to run by proceeding to the next block in the sequence. The filter block is designed to specify a subset of artifacts before further processing, and only artifacts matching the specified condition are passed along to downstream blocks for processing1. If no artifacts meet the conditions, the playbook does not end or restart; instead, it moves on to the next block, which could be any type of block depending on the playbook’s design1.
Reference: Use filters in your Splunk SOAR (Cloud) playbook to specify a subset of artifacts before further processing – Splunk Documentation
Which of the following queries would return all artifacts that contain a SHA1 file hash?
- A . https://<PHANTOM_URL>/rest/artifact?_filter_cef_md5_insull=false
- B . https://<PHANTOM_URL>/rest/artifact?_filter_cef_Shal_contains=””
- C . https://<PHANTOM_URL>/rest/artifact?_filter_cef_shal_insull=False
- D . https://<PHANTOM_URL>/rest/artifact?_filter_shal__insull=False
B
Explanation:
To return all artifacts that contain a SHA1 file hash using the Splunk SOAR REST API, the correct query would use the _filter_cef_Shal_contains parameter. This parameter filters the artifacts to only those that contain a value in the SHA1 field within the Common Event Format (CEF) data structure. The contains operator is used to match any artifacts that have a SHA1 hash present1.
Reference: Understanding artifacts – Splunk Documentation
How is a Django filter query performed?
- A . By adding parameters to the URL similar to the following:
phantom/rest/container?_filter_tags_contains="sumo". - B . phantom/rest/search/app/contains/"sumo"
- C . Browse to the Django Filter Query Editor in the Administration panel.
- D . Install the SOAR Django App first, then configure the search query in the App editor.
A
Explanation:
Django filter queries in Splunk SOAR are performed by appending filter parameters directly to the REST API URL. This allows users to refine their search and retrieve specific data. For example, to filter containers by tags containing the word "sumo", the following URL structure would be used: https://<PHANTOM_URL>/rest/container?_filter_tags_contains="sumo". This format enables users to construct dynamic queries that can filter results based on specified criteria within the Django framework used by Splunk SOAR.
The correct way to perform a Django filter query in Splunk SOAR is to add parameters to the URL similar to the following: phantom/rest/container?_filter_tags_contains=“sumo”. This will return a list of containers that have the tag “sumo” in them. You can use various operators and fields to filter the results according to your needs. For more details, see Query for Data and Use filters in your Splunk SOAR (Cloud) playbook to specify a subset of artifacts before further processing. The other options are either incorrect or irrelevant for this question. For example:
• phantom/rest/search/app/contains/“sumo” is not a valid URL for a Django filter query. It will return an error message saying “Invalid endpoint”.
• There is no Django Filter Query Editor in the Administration panel of Splunk SOAR. You can use the REST API Tester to test your queries, but not to edit them.
• There is no SOAR Django App that needs to be installed or configured for performing Django filter queries. Splunk SOAR uses the Django framework internally, but you do not need to install or use any additional apps for this purpose.
A user has written a playbook that calls three other playbooks, one after the other. The user notices that the second playbook starts executing before the first one completes.
What is the cause of this behavior?
- A . Synchronous execution has not been configured.
- B . The first playbook is performing poorly.
- C . The sleep option for the second playbook is not set to a long enough interval.
- D . Incorrect join configuration on the second playbook.
A
Explanation:
In Splunk SOAR, playbooks can execute actions either synchronously (waiting for one action to complete before starting the next) or asynchronously (allowing actions to run concurrently). If a playbook starts executing before the previous one has completed, it indicates that synchronous execution has not been properly configured between these playbooks. This is crucial when the output of one playbook is a dependency for the subsequent playbook. Options B, C, and D do not directly address the observed behavior of concurrent playbook execution, making option A the most accurate explanation for why the second playbook starts before the completion of the first.
synchronous execution is a feature of the SOAR automation engine that allows you to control the order of execution of playbook blocks. Synchronous execution ensures that a playbook block waits for the completion of the previous block before starting its execution. Synchronous execution can be enabled or disabled for each playbook block in the playbook editor, by toggling the Synchronous Execution switch in the block settings. Therefore, option A is the correct answer, as it states the cause of the behavior where the second playbook starts executing before the first one completes.
Option B is incorrect, because the first playbook performing poorly is not the cause of the behavior, but rather a possible consequence of the behavior.
Option C is incorrect, because the sleep option for the second playbook is not the cause of the behavior, but rather a workaround that can be used to delay the execution of the second playbook.
Option D is incorrect, because the join configuration on the second playbook is not the cause of the behavior, but rather a way of merging multiple paths of execution into one.
A user wants to use their Splunk Cloud instance as the external Splunk instance for Phantom.
What ports need to be opened on the Splunk Cloud instance to facilitate this? Assume default ports are in use.
- A . TCP 8088 and TCP 8099.
- B . TCP 80 and TCP 443.
- C . Splunk Cloud is not supported.
- D . TCP 8080 and TCP 8191.
B
Explanation:
To integrate Splunk Phantom with a Splunk Cloud instance, network communication over certain ports is necessary. The default ports for web traffic are TCP 80 for HTTP and TCP 443 for HTTPS. Since Splunk Cloud instances are accessed over the internet, ensuring that these ports are open is essential for Phantom to communicate with Splunk Cloud for various operations, such as running searches, sending data, and receiving results. It is important to note that TCP 8088 is typically used by Splunk’s HTTP Event Collector (HEC), which may also be relevant depending on the integration specifics.
Which of the following cannot be marked as evidence in a container?
- A . Action result
- B . Artifact
- C . Note
- D . Comment
D
Explanation:
In Splunk SOAR, the following elements can be marked as evidence within a container: action results, artifacts, and notes. These are crucial elements that contribute directly to incident analysis and can be selected as evidence to support investigation outcomes or legal proceedings.
However, comments cannot be marked as evidence. Comments are usually informal and meant for communication between users, providing context or updates but not serving as formal evidence within the system. Action results, artifacts, and notes, on the other hand, contain critical data related to the incident that could be useful for audit and investigative purposes, making them eligible to be marked as evidence.
Reference: Splunk SOAR Documentation: Working with Evidence.
Splunk SOAR Best Practices: Evidence Collection and Management.
What does a user need to do to have a container with an event from Splunk use context-aware actions designed for notable events?
- A . Include the notable event’s event_id field and set the artifacts label to aplunk notable event id.
- B . Rename the event_id field from the notable event to splunkNotableEventld.
- C . Include the event_id field in the search results and add a CEF definition to Phantom for event_id, datatype splunk notable event id.
- D . Add a custom field to the container named event_id and set the custom field’s data type to splunk notable event id.
C
Explanation:
For a container in Splunk SOAR to utilize context-aware actions designed for notable events from Splunk, it is crucial to ensure that the notable event’s unique identifier (event_id) is included in the search results pulled into SOAR. Moreover, by adding a Common Event Format (CEF) definition for the event_id field within Phantom, and setting its data type to something that denotes it as a Splunk notable event ID, SOAR can recognize and appropriately handle these identifiers. This setup facilitates the correct mapping and processing of notable event data within SOAR, enabling the execution of context-aware actions that are specifically tailored to the characteristics of Splunk notable events.