
SAS Institute A00-485 Practice Exams
Last updated on Oct 22,2026- Exam Code: A00-485
- Exam Name: Modeling Using SAS Visual Statistics
- Certification Provider: SAS Institute
- Latest update: Oct 22,2026
When building a Generalized Linear Model in SAS Visual Statistics, which link function is available?
- A . Poisson
- B . Gaussian
- C . Negative Binomial
- D . Log
Refer to the Parallel Coordinates Plot shown on the Exhibit.
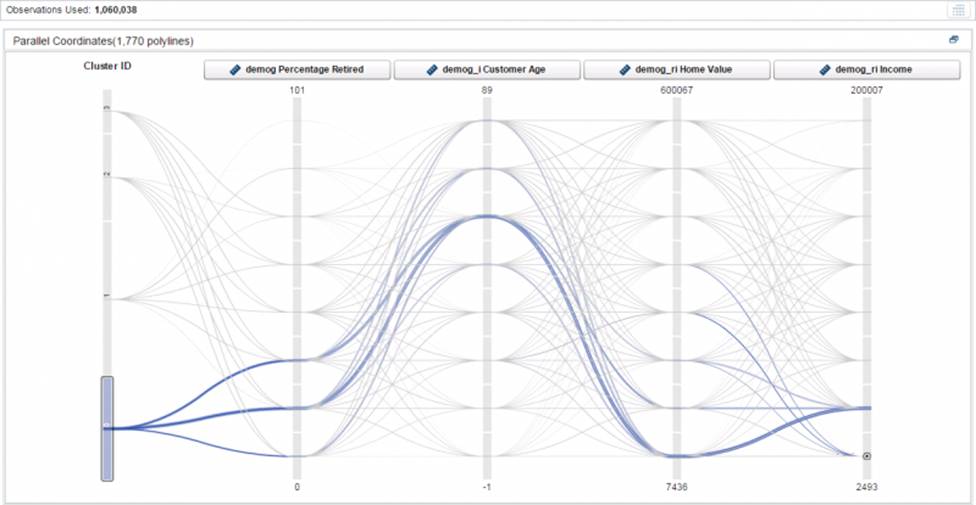
Which two statements about cluster 0 in the Parallel Coordinates Plot are correct? (Choose two.)
- A . It contains the most observations.
- B . In relation to the other clusters, it consists of people from the lower income group.
- C . In relation to the other clusters, it consists of people who are younger.
- D . In relation to the other clusters, it consists of people whose house values are lower.
Refer to the exhibit:
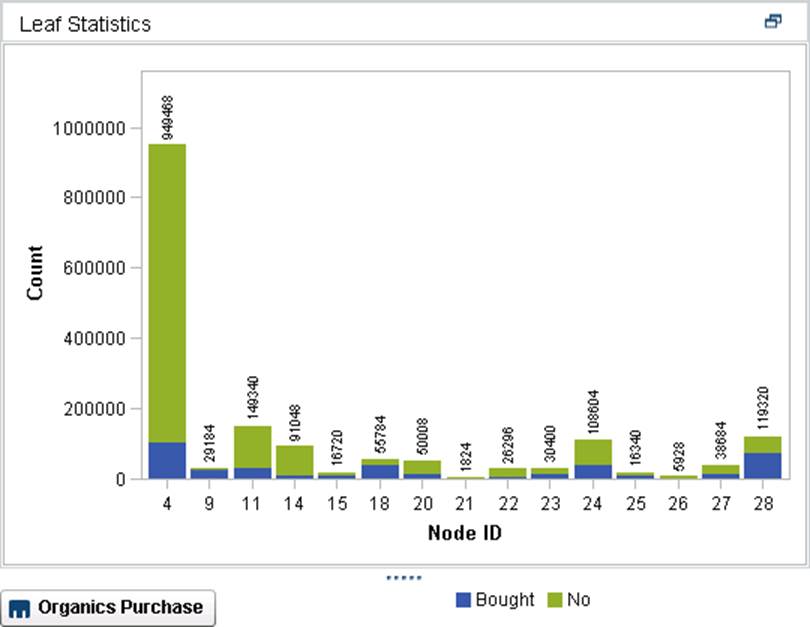
A retailer wants to use a decision tree to select one segment to mail 35,000 coupons to existing customers for a new line of organic products.
Assuming that customers who have purchased organic products in the past are likely to want new organic products in the future, select the single best Leaf ID for the mailing.
- A . 18
- B . 15
- C . 17
- D . 12
When examining the Fit Summary for group-by models, what can you analyze to evaluate the model fit?
- A . R-squared value
- B . AIC (Akaike Information Criterion)
- C . BIC (Bayesian Information Criterion)
- D . p-value for the group-by variable
In linear regression, what does a high p-value for a predictor variable suggest?
- A . The predictor is highly significant for the model.
- B . The predictor is not relevant for the model.
- C . The predictor has a strong linear relationship with the response.
- D . The predictor is a categorical variable.
Select the best distribution to model with linear regression.
A)
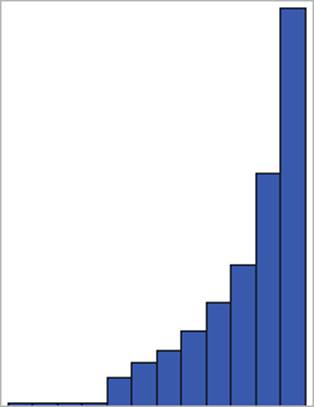
B)
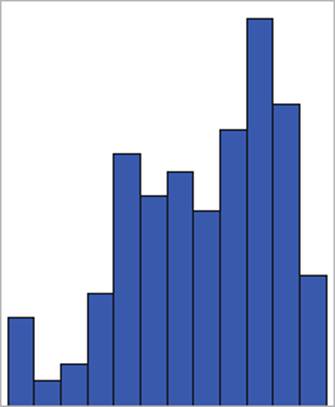
C)
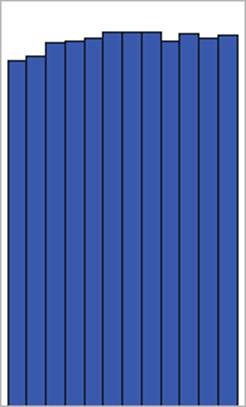
D)
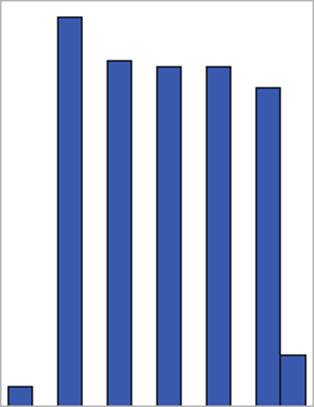
- A . Option A
- B . Option B
- C . Option C
- D . Option D
Refer to the exhibit from SAS Visual Statistics:
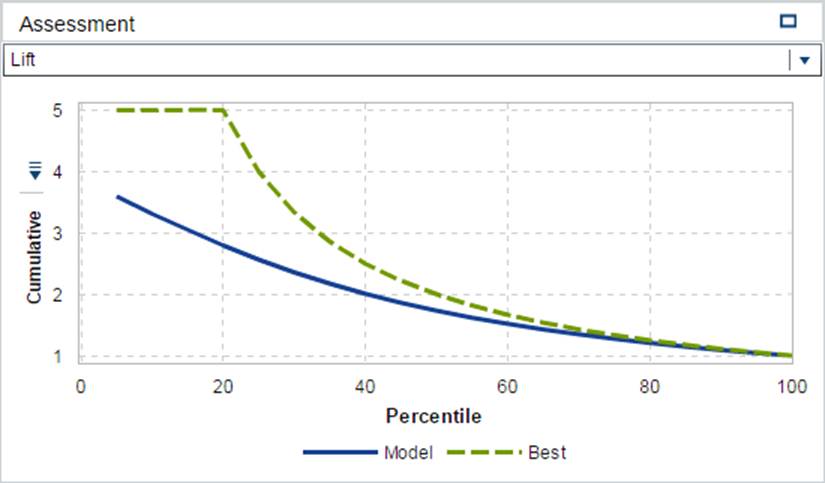
What can be concluded from the lift plot shown in the exhibit?
- A . The 20% of cases with the highest predicted probability of the modeled event level is expected to capture 2.75 times as many events as a random sample of the same size.
- B . The response rate for the best 20% is predicted to increase 5 times under the fitted model.
- C . The 20% of cases with the lowest predicted probability of the modeled event level is predicted to capture 2.75 times as many events as a random sample of 20%.
- D . The response rate for the best 20% is predicted to be 2.75 times greater than the sample fitted in the model.
How can you export score code generated by SAS Visual Statistics for a trained model?
- A . By copying and pasting it into a text editor
- B . By exporting it as a standalone script file
- C . By printing it directly from the SAS Visual Statistics interface
- D . By exporting it as a PDF document
What are the essentials of logistic regression?
- A . Modeling binary or ordinal outcomes
- B . Estimating probabilities of categorical outcomes
- C . Assuming a linear relationship between predictors and response
- D . Using the logit link function to model the probability of an event
Refer to the following exhibit:
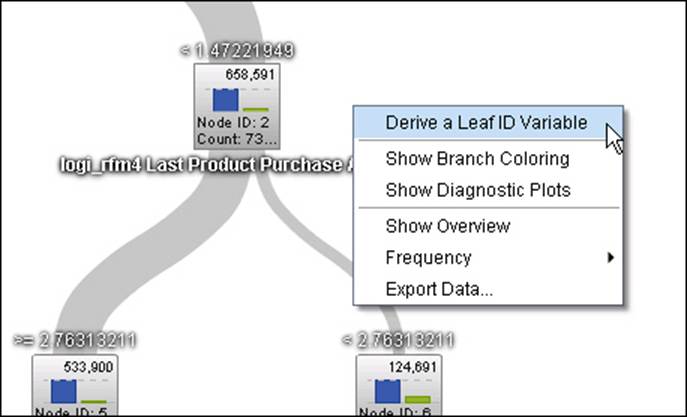
After creating a decision tree in SAS Visual Statistics, what is the value in deriving a Leaf ID Variable?
- A . Use the leaf ID data item in filters in other types of visualizations.
- B . Use the leaf ID to rank order by posterior probabilities.
- C . Use the leaf ID to identify clusters.
- D . Use the leaf ID to identify the most important variables.