
SAS Institute A00-485 Practice Exams
Last updated on Oct 22,2026- Exam Code: A00-485
- Exam Name: Modeling Using SAS Visual Statistics
- Certification Provider: SAS Institute
- Latest update: Oct 22,2026
What information can you interpret from a Cluster Matrix?
- A . The number of data points in each cluster
- B . The proximity or similarity between clusters
- C . The cluster centroids
- D . The order of cluster creation
Which statement is true regarding the Cluster Analysis in SAS Visual Statistics?
- A . An observation can belong to more than one cluster.
- B . Clusters may overlap in the Cluster Matrix plot.
- C . SAS Visual Statistics creates a measure variable containing the cluster ID when you derive a Cluster ID variable.
- D . You can derive a Cluster ID variable by right clicking on the Parallel Coordinates plot.
When interpreting comparison results using the Assessment panel, what information can be obtained?
- A . The distribution of predictor variables
- B . Model performance metrics, such as AUC and KS Statistic
- C . The relationship between two predictor variables
- D . The number of iterations performed by each model
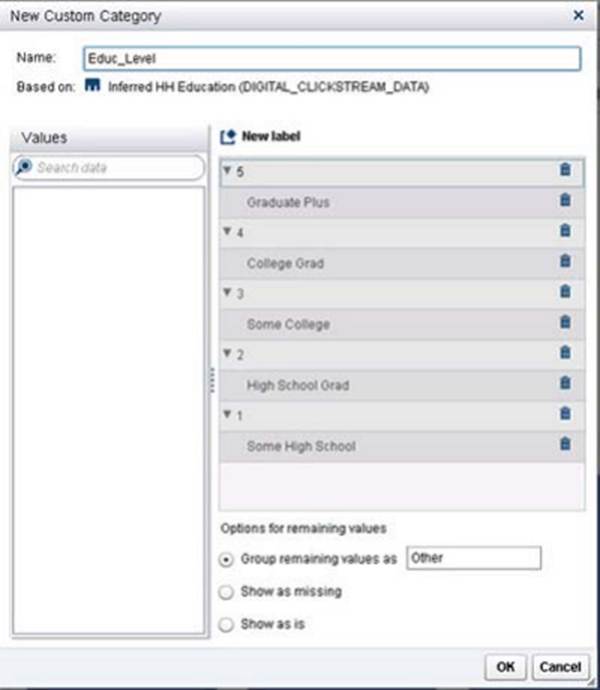
You would like to build a cluster analysis using several variables related to demographics. You noticed that the variable Inferred HH Education is a nominal variable with values of "High School Grad", "College Grad", etc.
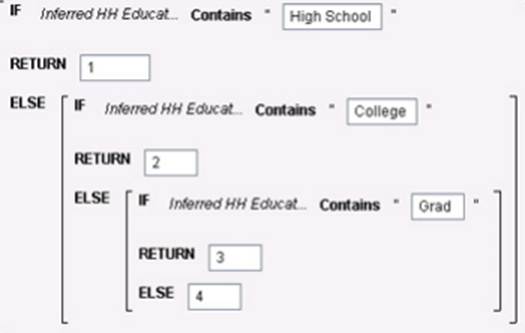
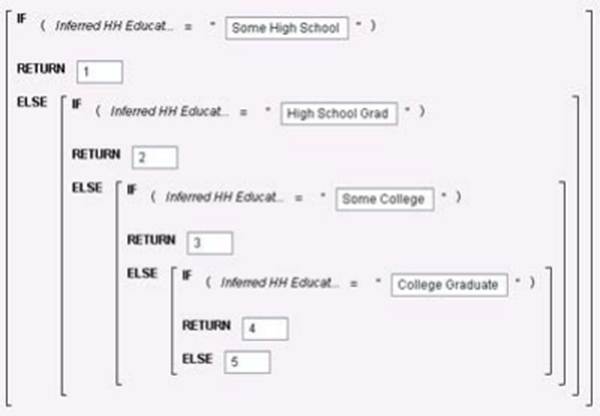
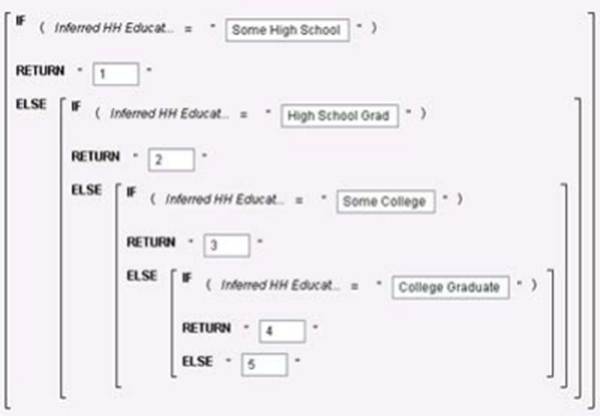
Which action allows you to incorporate this variable in the cluster analysis without returning a warning?
A)
B)
C)
D)
- A . Option A
- B . Option B
- C . Option C
- D . Option D
You want to use a generalized linear model to predict donation amount from a set of demographics predictors. Donation amount is known to be right-skewed, with many non-donors (donation amount = 0).
Which settings in the Generalized Linear Model task are most appropriate for modeling this response?
A)
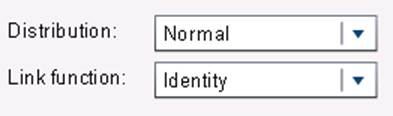
B)
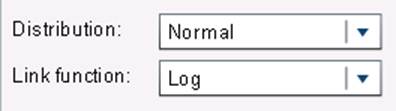
C)
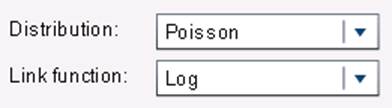
D)
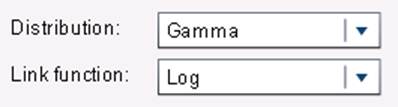
- A . Option A
- B . Option B
- C . Option C
- D . Option D
When investigating leaf nodes in a decision tree, what does it reveal about the data?
- A . The class labels assigned to each leaf node
- B . The feature values associated with each leaf node
- C . The decision rules leading to each leaf node
- D . The statistical significance of each leaf node
When examining the summary table for group-by processing, what information can you find?
- A . The number of observations in each group
- B . The mean value of the target variable for each group
- C . The standard deviation of the target variable for each group
- D . The distribution of the group-by variable
How can you interpret model results using the advanced group-by feature in SAS Visual Analytics?
- A . Analyze the impact of different levels of the group-by variable on the model outcome
- B . Explore interaction effects between the group-by variable and other predictors
- C . Visualize the predicted values for each level of the group-by variable
- D . Review the model coefficients for each level of the group-by variable
When assessing the quality of a linear regression model, what does a low p-value associated with the F-statistic suggest?
- A . The model is a poor fit for the data.
- B . The model has a high level of multicollinearity.
- C . The model has a significant overall explanatory power.
- D . The model has a weak linear relationship with the response.
What does a Group-by Variable enable you to do in SAS Visual Statistics?
- A . Fit a model for every value of a measure’s distribution.
- B . Use variable selection.
- C . Leverage informative missingness for measure and category variables.
- D . Fit a model for each data segment defined by one or more category variables.