
SAS Institute A00-485 Practice Exams
Last updated on Oct 22,2026- Exam Code: A00-485
- Exam Name: Modeling Using SAS Visual Statistics
- Certification Provider: SAS Institute
- Latest update: Oct 22,2026
When modeling binary outcomes in a generalized linear model, which distribution and link function combination is commonly used?
- A . Normal distribution with an identity link function
- B . Poisson distribution with a log link function
- C . Binomial distribution with a logit link function
- D . Exponential distribution with a square root link function
In SAS Visual Analytics, which tool is commonly used to transform variables using functions like logarithm or square root?
- A . SAS Visual Data Builder
- B . SAS Enterprise Miner
- C . SAS Studio
- D . SAS Enterprise Guide
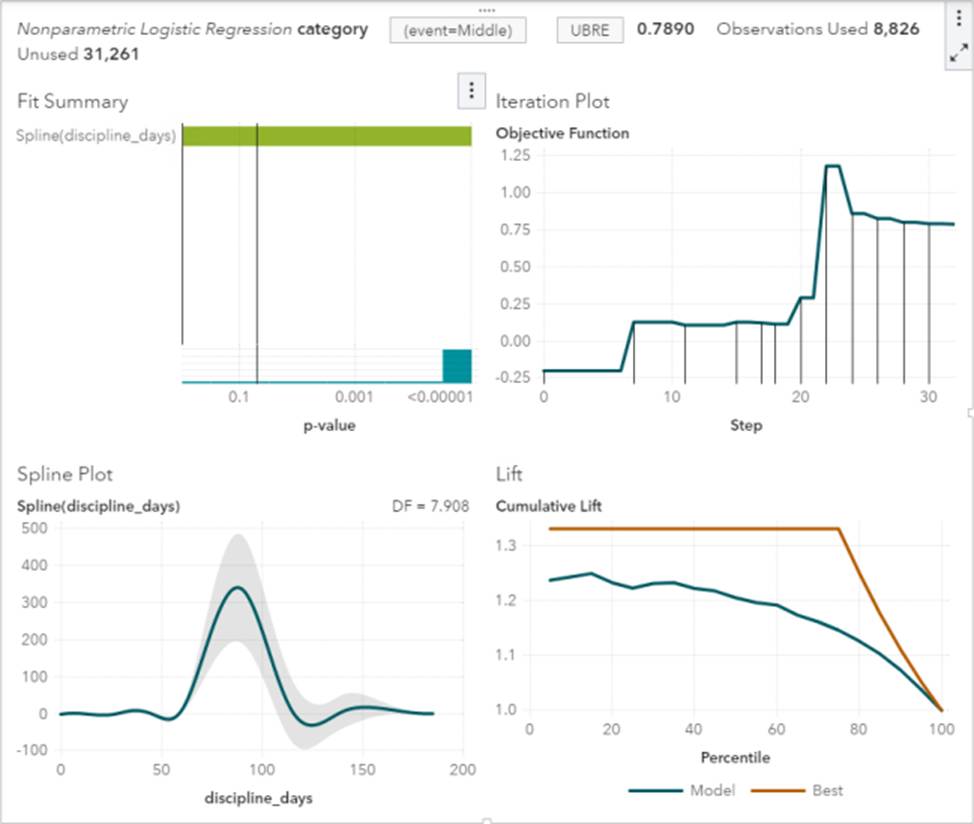
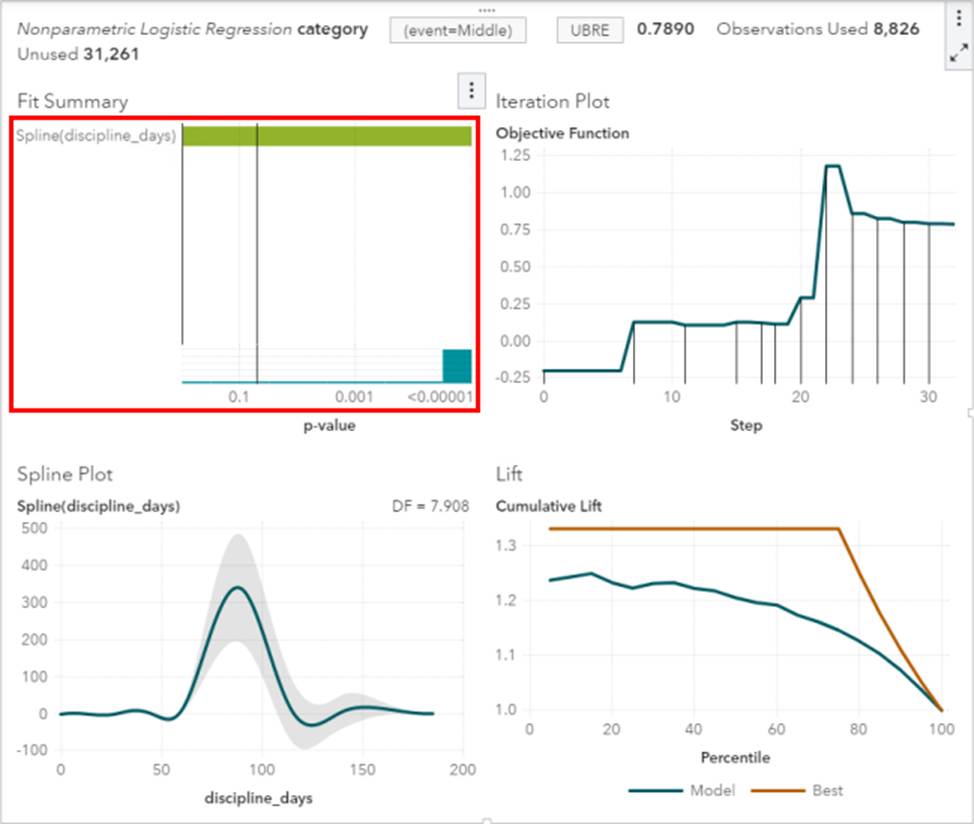
In the below nonparametric logistic regression results display, where would you click to get a plot of significant continuous effects?
How can you assign a group-by variable to a predictive model in SAS Visual Analytics?
- A . Drag and drop the group-by variable into the predictor field of the model
- B . Select the group-by variable from a dropdown menu in the model settings
- C . Specify the group-by variable in the data source properties
- D . Click on the group-by variable and choose "Assign as predictor" from the context menu
What does the interactive group-by feature in SAS Visual Analytics allow you to do?
- A . Dynamically change the group-by variable during analysis
- B . Apply group-by modeling to multiple measures simultaneously
- C . Interactively explore different levels of the group-by variable
- D . Create subgroups within the group-by variable
Which SAS tool is suitable for creating complex data manipulation and transformation workflows in a visual interface?
- A . SAS Visual Analytics
- B . SAS Enterprise Guide
- C . SAS Studio
- D . SAS Visual Data Builder
Refer to the exhibits:
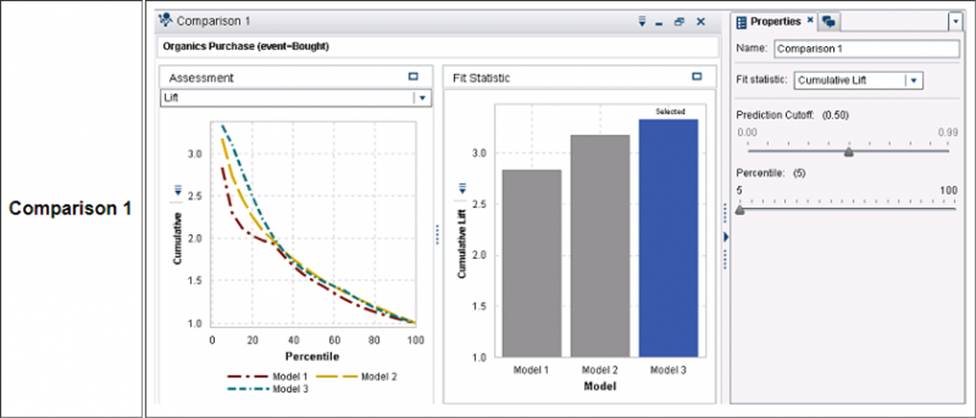
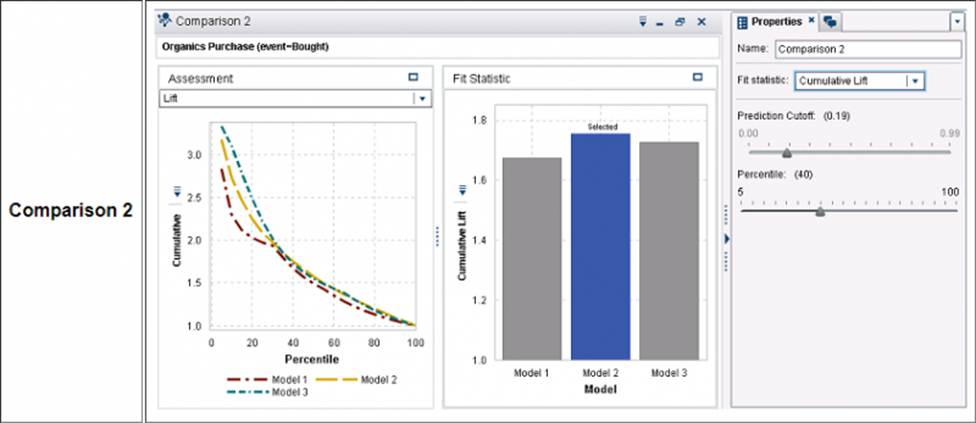
An analyst is evaluating which model to use.
What changed from Comparison 1 to Comparison 2 to select a different champion model?
- A . Prediction Cutoff reduced from .5 to .19
- B . Percentile changed from 5th percentile to 40th percentile
- C . Analyst clicked on Model 2 to highlight it
- D . Misclassification was used instead of Cumulative Lift
In SAS Visual Analytics, what can you use to choose the best fitting group-by model?
- A . Fit statistics such as AIC and BIC
- B . Variable Importance
- C . Visualization of model residuals
- D . Group-by variable with the highest p-value
How can score code be implemented to score new data using SAS Enterprise Miner?
- A . By pasting the code into a web browser
- B . By importing the code into SAS Data Integration Studio
- C . By creating a scoring node in a SAS Enterprise Miner process flow
- D . By manually executing the code in a command-line interface
Prior to fitting a regression model, data binning of a continuous effect should be used for what purpose?
- A . Improve the accuracy of your predictions.
- B . Reduce the impact of minor observation errors.
- C . Reduce the cardinality of a continuous effect.
- D . Gain information due to discretization.