
SAS Institute A00-470 Practice Exams
Last updated on Oct 21,2026- Exam Code: A00-470
- Exam Name: SAS Visual Analytics Using SAS Viya
- Certification Provider: SAS Institute
- Latest update: Oct 21,2026
How many data sources can each report section have in SAS VA Designer?
- A . 1
- B . 250
- C . it is determined by the preferences
- D . Unlimited
Refer to the exhibit below:
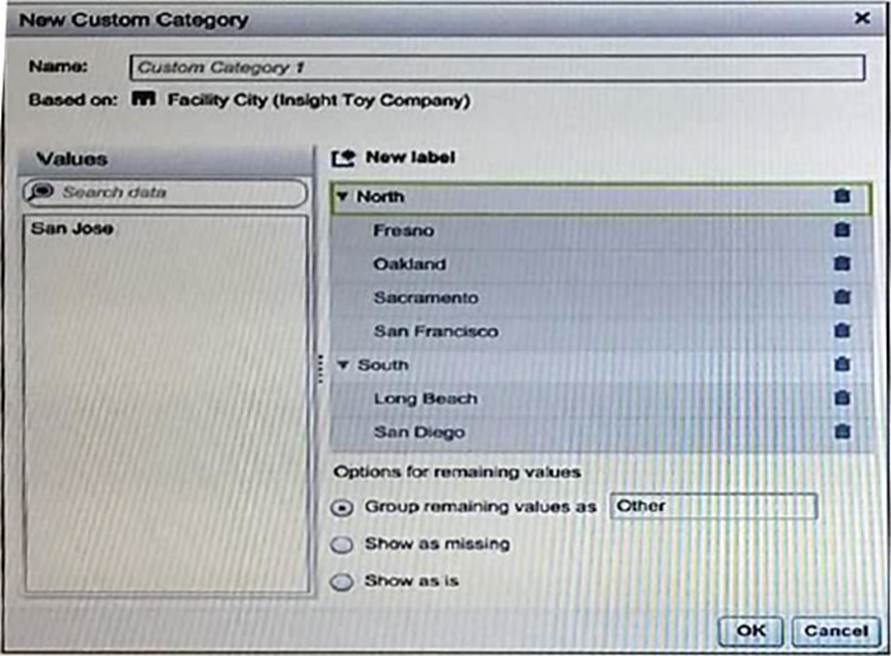
Assuming that there are data values for each city, how many different labels will be displayed when using this data item?
- A . 2
- B . 3
- C . 6
- D . 7
Which option CANNOT be added to a scatter plot or heat map?
- A . Linear
- B . Quadratic
- C . Cubic
- D . Exponential
When importing a Microsoft Excel file using local files, what changes can be made to the destination table?
- A . Rename table
- B . Hide columns
- C . Format columns
- D . Filter rows
Refer to the box plot from SAS Visual Analytics on the right.
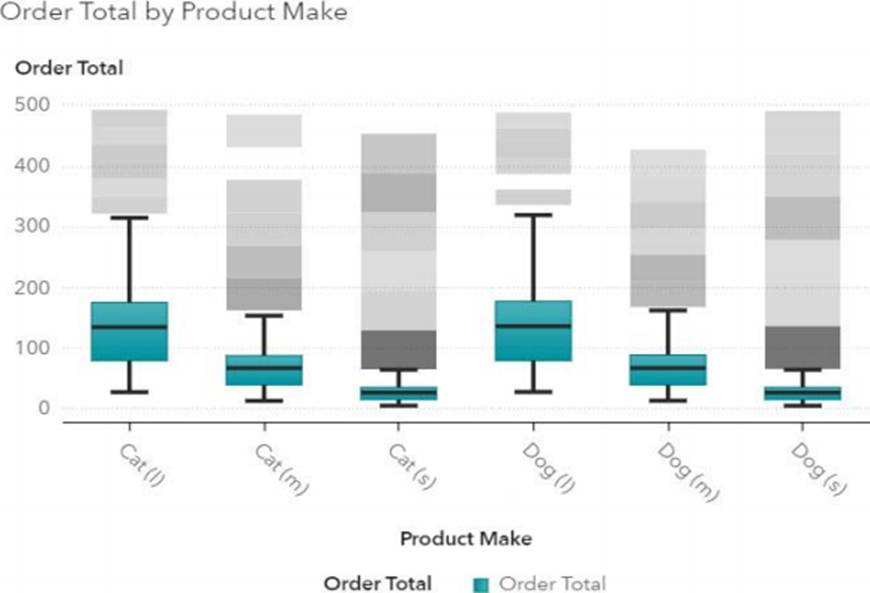
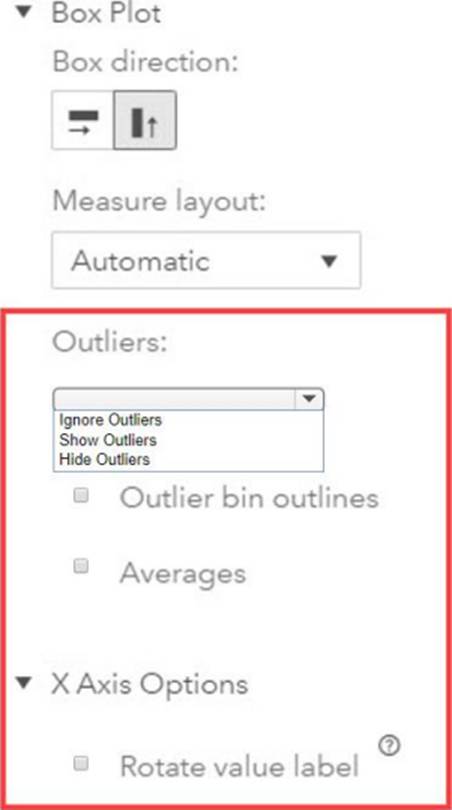
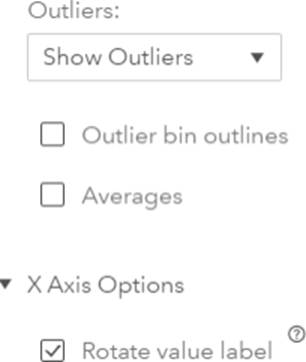
In the work area below, a Properties Panel for the box plot is shown. There is one drop down menu and three check boxes inside a red box. Configure the drop down menu and check boxes values that will configure the box plot as shown.
Work area:
In SAS Visual Analytics Designer, which sharing option would require a report job to be created?
- A . E-mail option
- B . Batch E-mail option
- C . Distribute Reports option
- D . Report Alerts option
Refer to the exhibit below: two coloured sheet was given
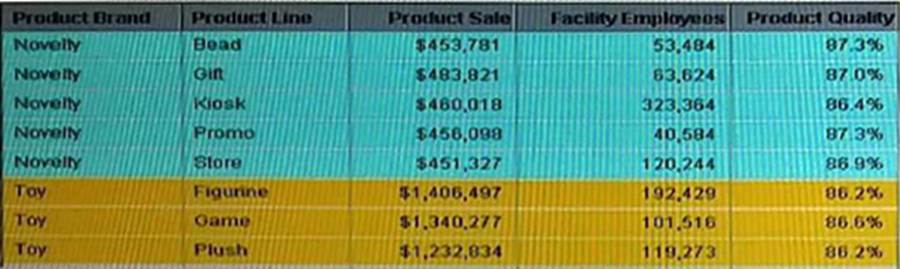
Which feature of SAS Visual Analytics Designer is used by this list table?
- A . Assigning the colors option for product brand
- B . Adding a gauge rule
- C . Adding a color mapped value display rule.
- D . Changing the background color using the styles tab.
Refer the exhibit below, USA Map shown:
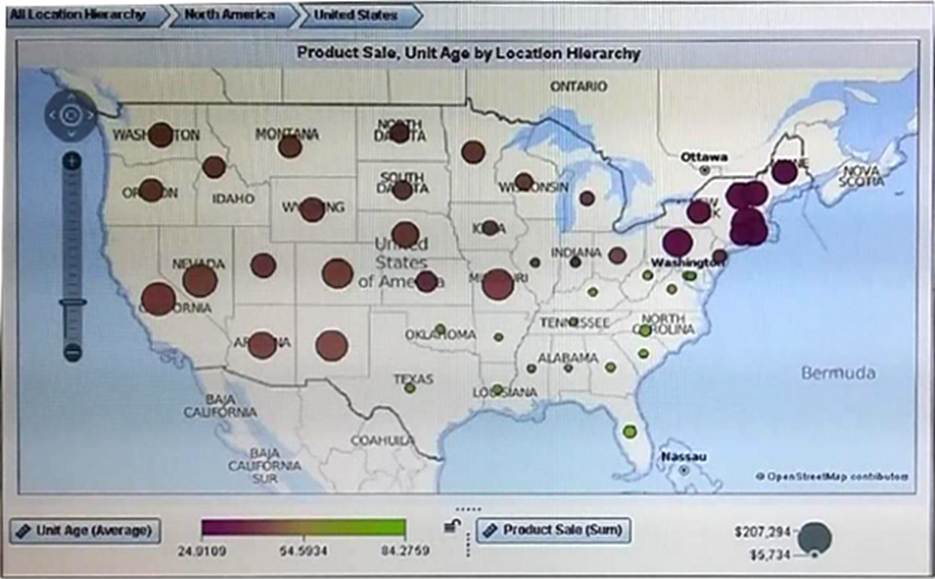
What must a content developer do to create this chart using the automatic chart visualization? (Choose Three).
- A . Select the geo map visualization
- B . Hold down the ctrl key and drag location hierarchy, unit age and product sale to the workspace.
- C . Hold down the ctrl key and drag continent, country, State, Unit age and product sale onto the work space
- D . Specify the continent, country, and state as geometry data items
- E . Create the location Hierarchy that uses continent, country, and state geography data items
There are two visualizations given in the area:
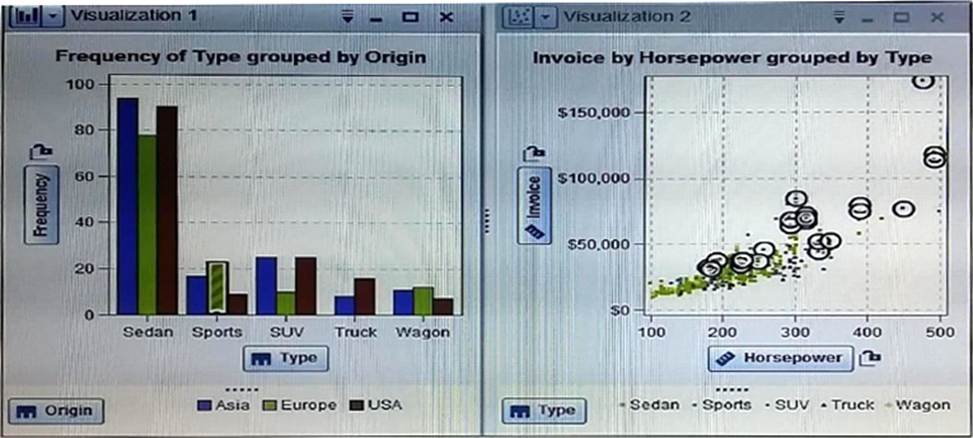
When a bar is selected in the bar chart, the markers in the scatter plot that correspond to the selected value in the bar area are highlighted.
This feature used in SAS Visual Analytics Explorer called:
- A . Report level display rules
- B . Data Brushing
- C . Conditional Highlighting
- D . File interaction
Which action creates a new measure that contains a count of the unique values for any particular category?
- A . Right-click a category data item in the Data pane and select New calculation, then select Distinct count.
- B . Right-click a category data item in the Data pane and select Create unique values.
- C . Expand the properties of the data item in the Data pane and change the Classification to Measure.
- D . Expand the properties of the data item in the Data pane and change the Aggregation to Count.