
SAS Institute A00-470 Practice Exams
Last updated on Oct 22,2026- Exam Code: A00-470
- Exam Name: SAS Visual Analytics Using SAS Viya
- Certification Provider: SAS Institute
- Latest update: Oct 22,2026
In a bar chart, what is the effect of setting the Group scale option to Normalize groups to 100%?
- A . Bar charts that group a data item are adjusted so that measures are totaled to 100% across the entire chart.
- B . Bar charts that group a data item are adjusted so that measures in each separate group total 100%.
- C . Bar charts that use lattice column data items are adjusted so that measures in each separate lattice column total 100%.
- D . Bar charts that use lattice column data items are adjusted so that measures are totaled to 100% across the entire chart.
For a cross tab report object created in SAS Visual Analytics Designer, which statement is true?
- A . If a hierarchy data item is assigned to the rows role, no other data items may be assigned to the rows role.
- B . A geography data item that has custom latitude and longitude specified may be added to row data items.
- C . Filters may be applied to both row and column data items, but ranks can only be applied to row data items.
- D . Ascending and descending sorting may be used with both row and column data items but a custom sort can only be used with row data items.
In SAS Visual Analytics Designer, the data items in the data tab are displayed based on classification.
What is the process to group data items on the data tab in alphabetical order.
- A . Select options on the data tab, and select Group items by first letter
- B . Select options on the data tab, and select refresh tab
- C . Right click in the data tab and select refresh data
- D . Right click on the data tab and select sort alphabetically.
In SAS Visual Analytics Explorer, which feature explores underlying Factors by specifying Target Values for the Forecast Measure?
- A . Scenario Analysis
- B . Goal Seeking
- C . Forecast targeting
- D . Goal Analysis
Which statement is true when importing an excel file with multiple work sheets into SAS Visual Analytics Designer
- A . Only one work sheet can be imported at a time from excl files with multiple worksheets
- B . All selected work sheets are imported as separate tables
- C . You cannot import excel files with multiple work sheets
- D . All selected worksheets are imported and concatenated together.
Refer to the exhibit below:
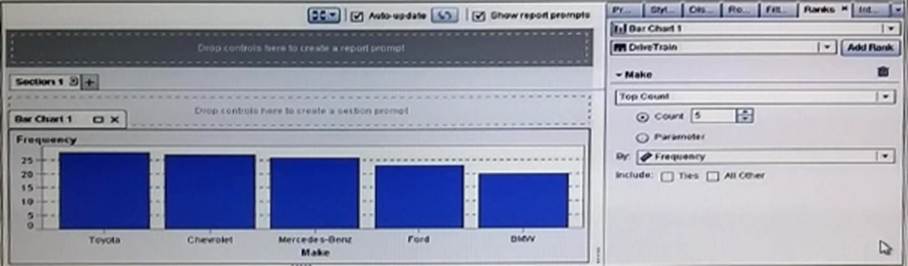
The bar chart in SAS Visual Analytics Designer has a rank based on the top five car makes by frequency.
What is the effect of selecting the parameter option?
- A . The number of bars will change to the current value of the parameter.
- B . The parameter will allow you to change the By group from frequency to another measure
- C . a Prompt will display asking for a value and then the graph would update.
- D . The parameter will allow you to change Top Count to either Bottom count, Top percent or Bottom percent
In SAS Visual Analytics Designer, which feature is used to email multiple reports at the same time?
- A . e-mail option
- B . Schedule reports option
- C . batch E mail option
- D . Distribute reports option
Which two types of network analysis can you create in SAS Visual Analytics? (Choose two.)
- A . Ungrouped
- B . Hierarchical
- C . Grouped
Clustered
Refer to the exhibit below from SAS Visual Analytics Designer.
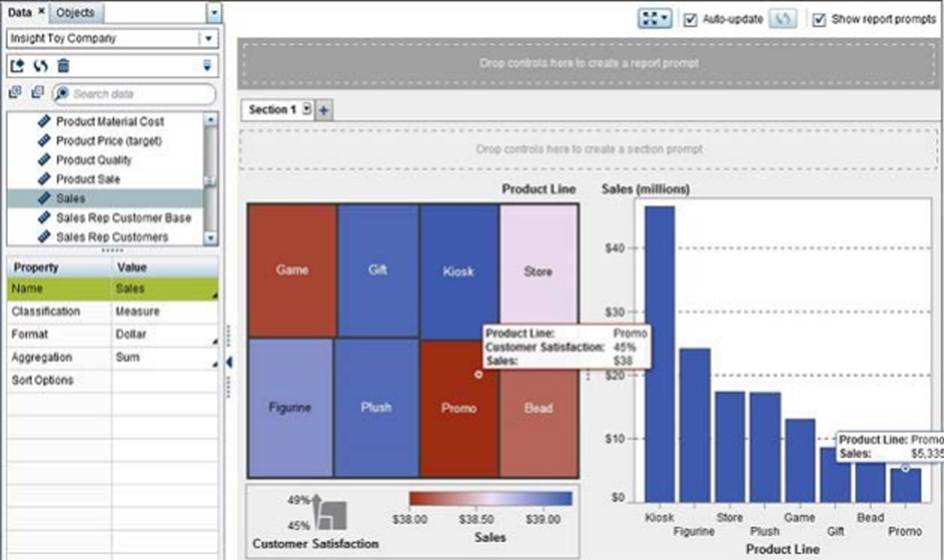
Why is the value for Sales lower in the treemap than in the bar chart?
- A . The aggregation for Sales was changed in the treemap.
- B . A rank was established on the treemap to only show the top eight values.
- C . A data source filter was applied to the treemap.
- D . The measure in the treemap is Sales and the measure in the bar chart is Sales (millions).
Refer to the exhibits:
Exhibit A
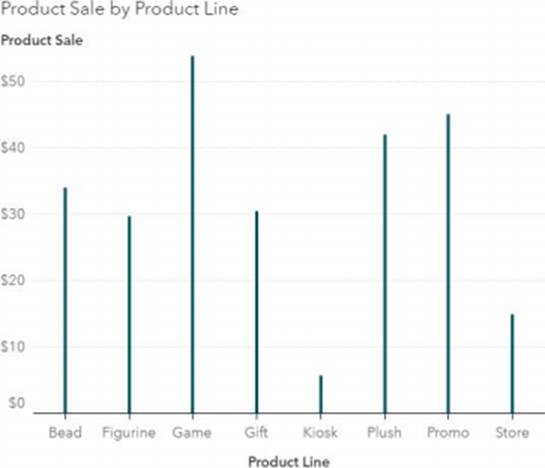
Exhibit B
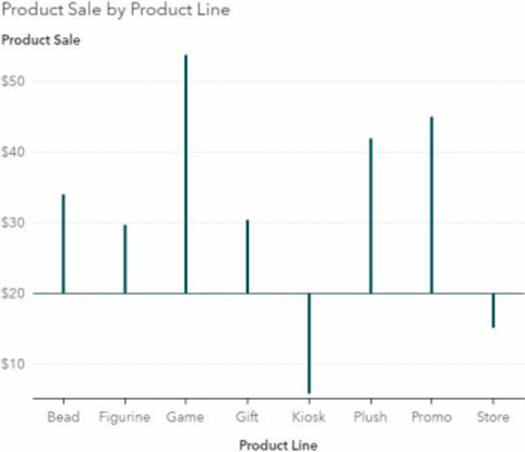
How do you change the needle plot in Exhibit A to look like Exhibit B?
- A . Change the fixed minimum value on the Y axis in the Options pane.
- B . Override the system data limit in the Options pane.
- C . Add a fixed baseline in the Options pane.
- D . Add a reference line in the Options pane.