
Microsoft PL-300 Practice Exams
Last updated on Nov 16,2026- Exam Code: PL-300
- Exam Name: Microsoft Power BI Data Analyst
- Certification Provider: Microsoft
- Latest update: Nov 16,2026
Note: This question is part of a series of questions that present the same scenario. Each question in the series contains a unique solution that might meet the stated goals. Some question sets might have more than one correct solution, while others might not have a correct solution.
After you answer a question in this section, you will NOT be able to return to it. As a result, these questions will not appear in the review screen.
You are modeling data by using Microsoft Power Bl. Part of the data model is a large Microsoft SQL Server table named Order that has more than 100 million records.
During the development process, you need to import a sample of the data from the Order table.
Solution: You add a report-level filter that filters based on the order date.
Does this meet the goal?
- A . Yes
- B . No
You need to create the required relationship for the executive’s visual.
What should you do before you can create the relationship?
- A . Change the data type of Sales[region_id] to Whole Number.
- B . In the Sales table, add a measure for sum(sales_amount).
- C . Change the data type of sales[sales_id] to Text.
- D . Change the data type of sales [region_id] to Decimal Number.
DRAG DROP
You receive revenue data that must be included in Microsoft Power Bl reports.
You perform an initial load of the data from a Microsoft Excel source as shown in the following exhibit.
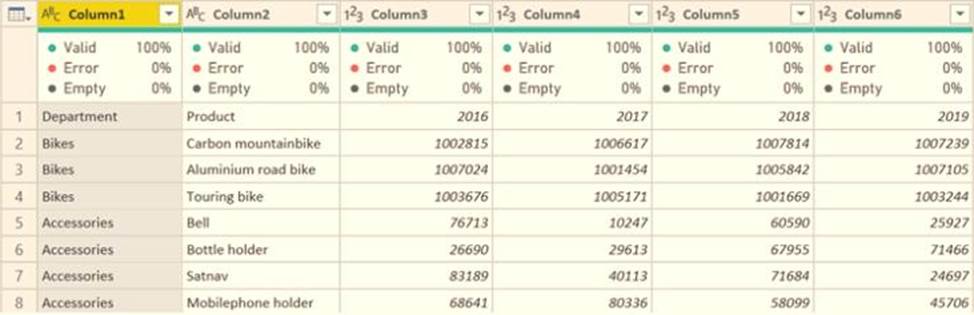
You plan to create several visuals from the data, including a visual that shows revenue split by year and product.
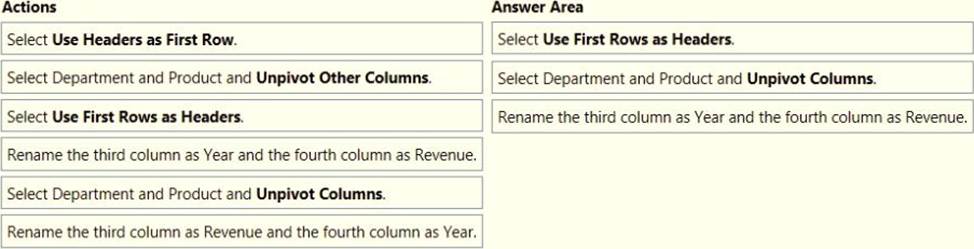
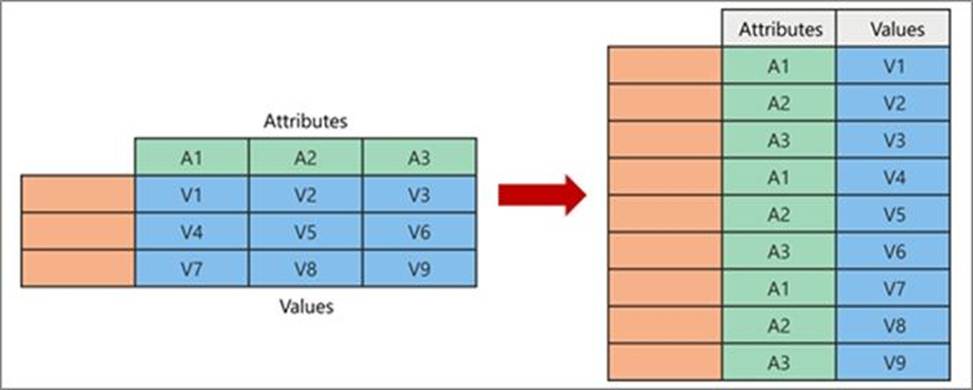
You need to transform the data to ensure that you can build the visuals. The solution must ensure that the columns are named appropriately for the data that they contain.
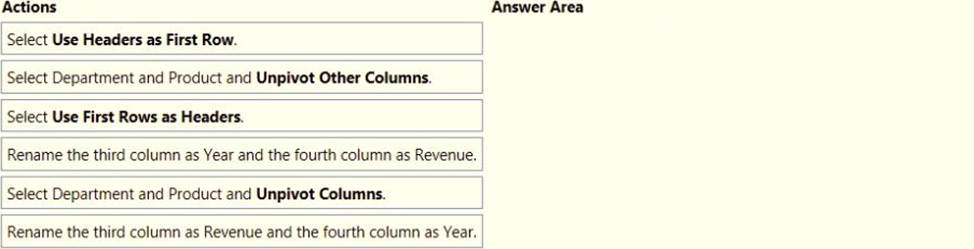
Which three actions should you perform in sequence? To answer, move the appropriate actions from the list of actions to the answer area and arrange them in the correct order.
You have a report that contains three pages. One of the pages contains a KPI visualization. You need to filter all the visualizations in the report except for the KPI visualization.
Which two actions should you perform? Each correct answer presents part of the solution. NOTE: Each correct selection is worth one point.
- A . Add the same slicer to each page and configure Sync slicers.
- B . Edit the interactions of the KPI visualization.
- C . Configure a page-level filter.
- D . Edit the interactions of the slicer that is on the same page as the KPI visualization.
- E . Configure a report-level filter.
You have a report that contains three pages. One of the pages contains a KPI visualization. You need to filter all the visualizations in the report except for the KPI visualization.
Which two actions should you perform? Each correct answer presents part of the solution. NOTE: Each correct selection is worth one point.
- A . Add the same slicer to each page and configure Sync slicers.
- B . Edit the interactions of the KPI visualization.
- C . Configure a page-level filter.
- D . Edit the interactions of the slicer that is on the same page as the KPI visualization.
- E . Configure a report-level filter.
You have a report that contains three pages. One of the pages contains a KPI visualization. You need to filter all the visualizations in the report except for the KPI visualization.
Which two actions should you perform? Each correct answer presents part of the solution. NOTE: Each correct selection is worth one point.
- A . Add the same slicer to each page and configure Sync slicers.
- B . Edit the interactions of the KPI visualization.
- C . Configure a page-level filter.
- D . Edit the interactions of the slicer that is on the same page as the KPI visualization.
- E . Configure a report-level filter.
You have a Microsoft Power BI data model that contains three tables named Orders, Date, and City.
There is a one-to-many relationship between Date and Orders and between City and Orders.
The model contains two row-level security (RLS) roles named Role1 and Role2.
Role1 contains the following filter.
City[State Province] = "Kentucky"
Role2 contains the following filter.
Date[Calendar Year] = 2020
If a user is a member of both Role1 and Role2, what data will they see in a report that uses the model?
- A . The user will see data for which the State Province value is Kentucky and the Calendar Year is 2020.
- B . The user will see data for which the State Province value is Kentucky or the Calendar Year is 2020.
- C . The user will see only data for which the State Province value is Kentucky.
- D . The user will receive an error and will not be able to see the data in the report.
You have the visual shown in the Original exhibit. {Click the Original tab.)
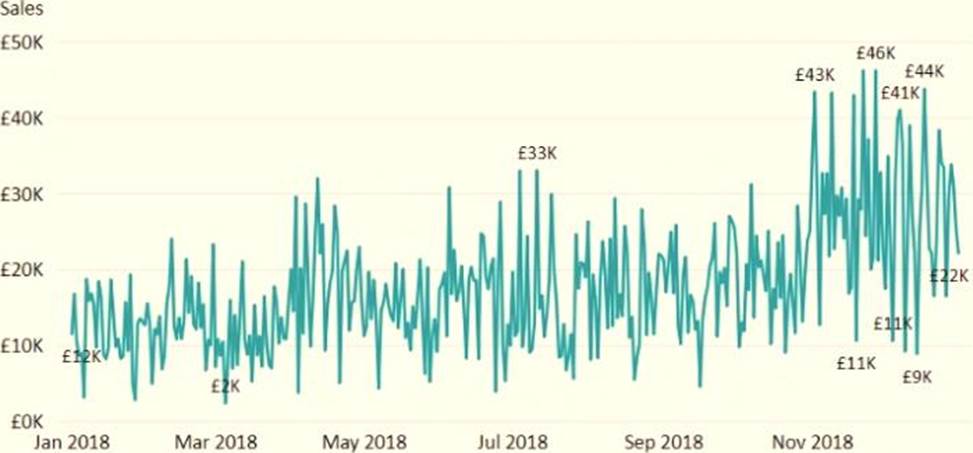
You need to configure the visual as shown in the Modified exhibit. (Click the Modified tab.)
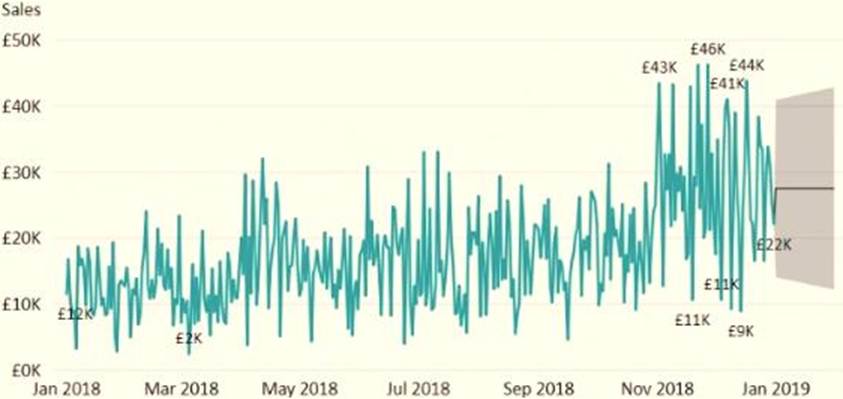
What should you add to the visual?
- A . a measure
- B . a trendline
- C . a forecast
- D . an Average line
You import a large dataset to Power Query Editor.
You need to identify whether a column contains only unique values.
Which two Data Preview options can you use? Each correct answer presents a complete solution. NOTE: Each correct selection is worth one point
- A . Show whitespace
- B . Column distribution
- C . Column profile
- D . Column quality
- E . Monospaced