
Microsoft PL-300 Practice Exams
Last updated on Nov 16,2026- Exam Code: PL-300
- Exam Name: Microsoft Power BI Data Analyst
- Certification Provider: Microsoft
- Latest update: Nov 16,2026
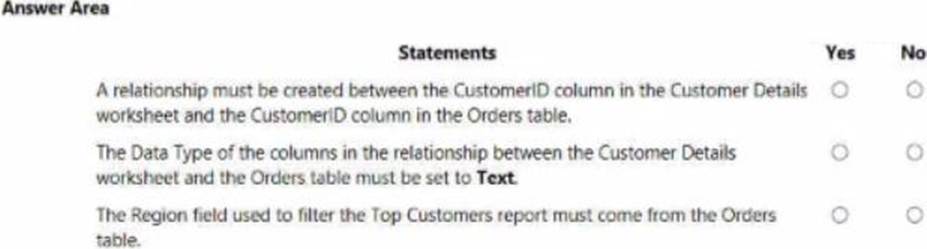
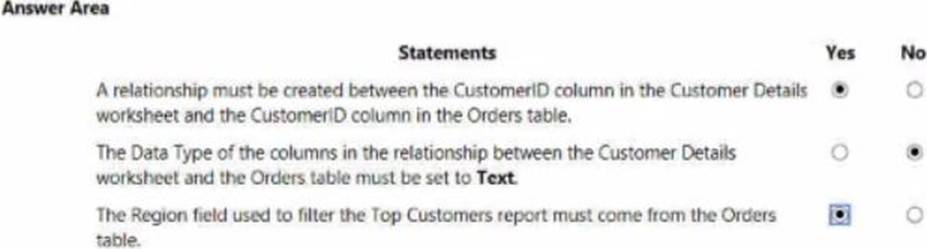
HOTSPOT
You need to design the data model and the relationships for the Customer Details worksheet and the Orders table by using Power BI. The solution must meet the report requirements.
For each of the following statement, select Yes if the statement is true, Otherwise, select No. NOTE: Each correct selection is worth one point.
HOTSPOT
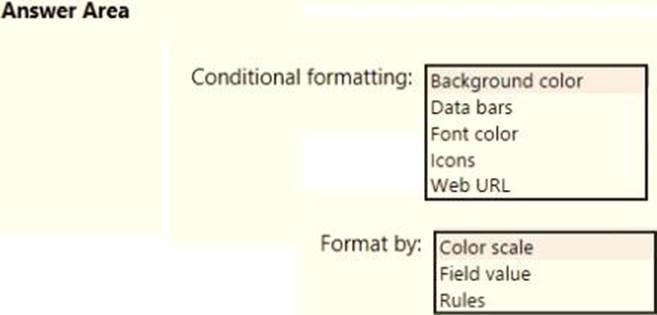
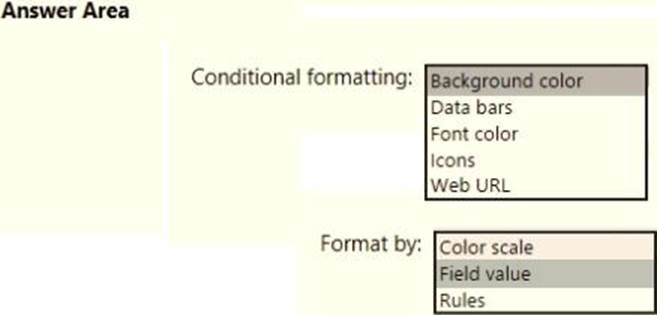
You need to create a visual as shown in the following exhibit.
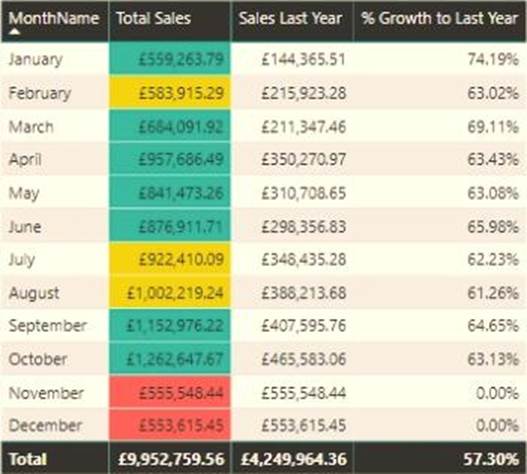
The indicator color for Total Sales will be based on % Growth to Last Year.
The solution must use the existing calculations only.
How should you configure the visual? To answer, select the appropriate options in the answer area. NOTE: Each correct selection is worth one point.
HOTSPOT
Your company has affiliates who help the company acquire customers.
You build a report for the affiliate managers at the company to assist them in understanding affiliate performance.
The managers request a visual showing the total sales value of the latest 50 transactions for each affiliate. You have a data model that contains the following tables.
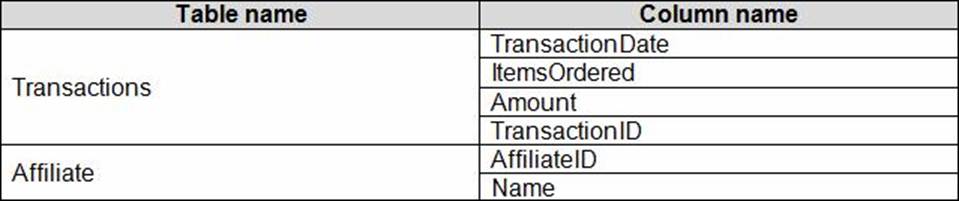
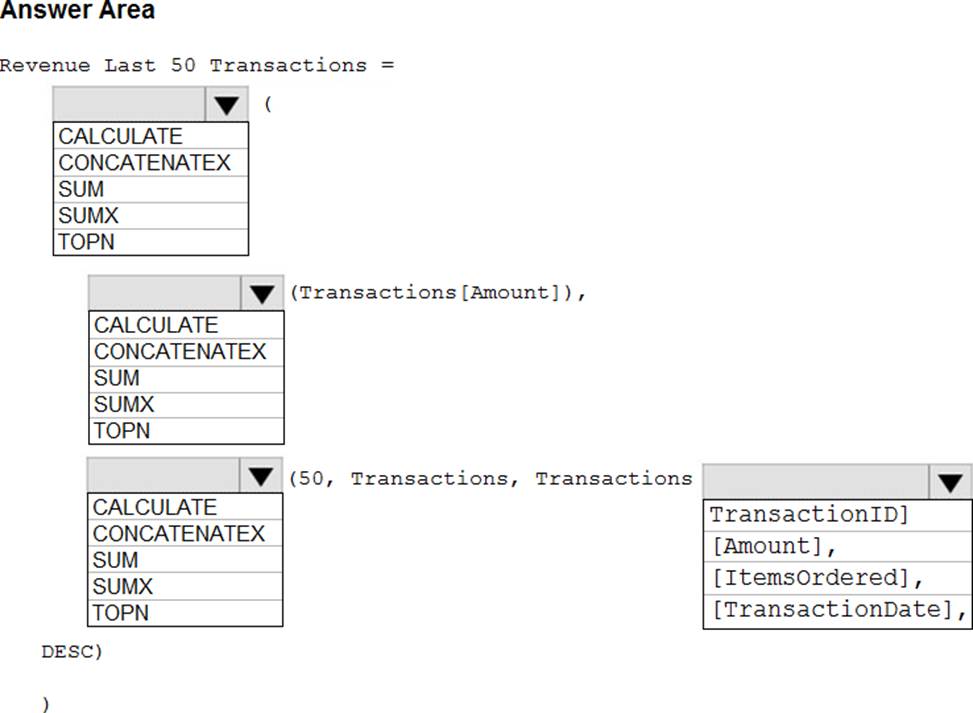
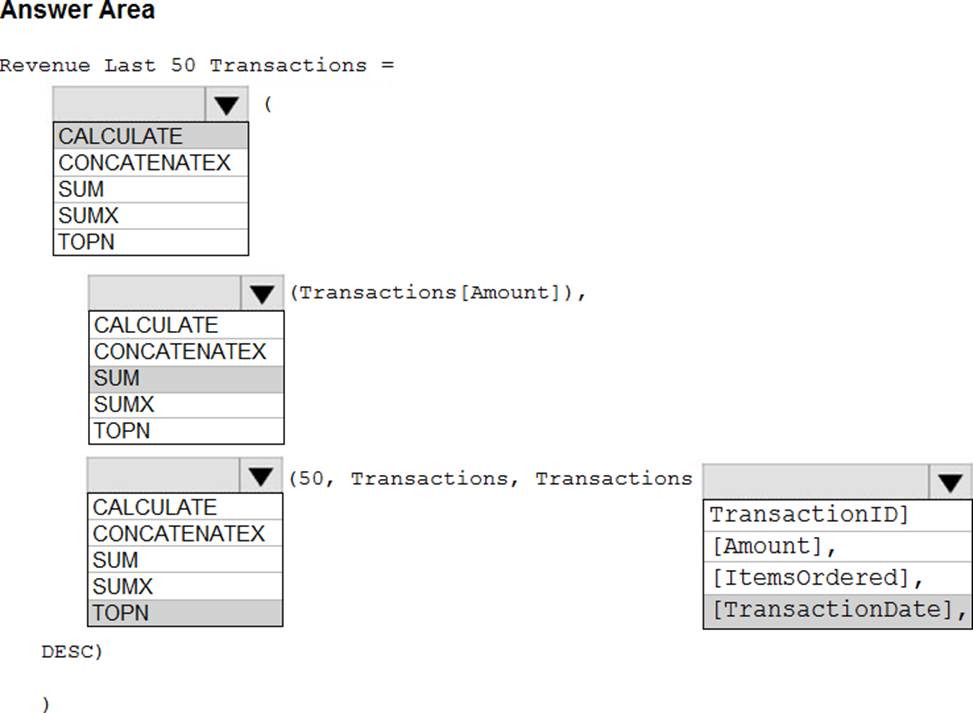
You need to develop a measure to support the visual.
How should you complete the DAX expression? To answer, select the appropriate options in the answer area. NOTE: Each correct selection is worth one point.
Note: This question is part of a series of questions that present the same scenario. Each question in the series contains a unique solution that might meet the stated goals. Some question sets might have more than one correct solution, while others might not have a correct solution.
After you answer a question in this section, you will NOT be able to return to it. As a result, these questions will not appear in the review screen.
You create a parameter named DataSourceExcel that holds the file name and location of a Microsoft Excel data source.
You need to update the query to reference the parameter instead of multiple hard-coded copies of the location within each query definition.
Solution: You create a new query that references DataSourceExcel.
Does this meet the goal?
- A . Yes
- B . No
You have a sales system that contains the tables shown in the following table.
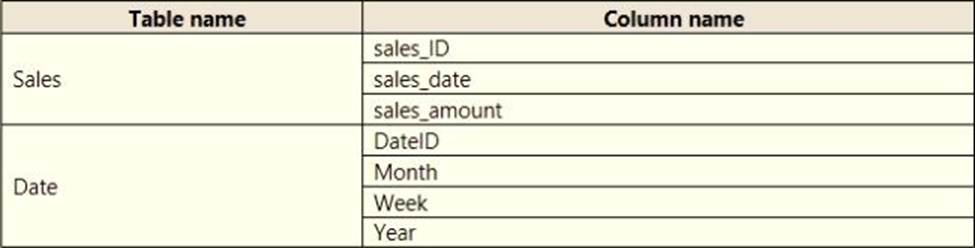
The Date table is marked as a date table.
DatelD is the date data type. You need to create an annual sales growth percentage measure.
Which DAX expression should you use?
- A . SUM(sales[sales_amount]) – CALCULATE(SUM(sales[sales_amount]), SAMEPERIODLASTYEAR(‘Date'[DateID])
- B . (SUM(‘Sales’[sales_amount]) – CALCULATE(SUM(‘Sales’[sales_amount]), SAMEPERIODLASTYEAR(‘Date’[DateID])))
/ CALCULATE(SUM(‘Sales’[sales_amount]), SAMEPERIODLASTYEAR(‘Date’[DateID])) - C . CALCULATE(SUM(sales[sales_amount]), DATESYTD(‘Date’[DateID]))
- D . CALCULATE(SUM(sales[sales_amount]), SAMEPERIODLASTYEAR(‘Date’[DateID]))
You have a report that contains four pages. Each page contains slicers for the same four fields. Users report that when they select values on a slicer on one page, the visuals are not updated on all the pages. You need to recommend a solution to ensure that users can select a value once to filter the results on all the pages.
What are two possible recommendations to achieve this goal? Each correct answer presents a complete solution. NOTE: Each correct selection is worth one point.
- A . Sync the slicers across the pages.
- B . Replace the slicers with page-level filters.
- C . Replace the slicers with visual-level filters.
- D . Create a bookmark for each slicer value.
- E . Replace the slicers with report-level filters.
Which DAX expression should you use to get the ending balances in the balance sheet reports?
- A . CALCULATE (
SUM( BalanceSheet [BalanceAmount] ),
DATESQTD( ‘Date'[Date] )
) - B . CALCULATE (
SUM( BalanceSheet [BalanceAmount] ),
LASTDATE( ‘Date'[Date] )
) - C . FIRSTNONBLANK ( ‘Date’ [Date]
SUM( BalanceSheet[BalanceAmount] )
) - D . CALCULATE (
MAX( BalanceSheet[BalanceAmount] ),
LASTDATE( ‘Date’ [Date] )
)
You need to configure access for the sales department users. The solution must me meet the security requirements.
What should you do?
- A . Add the sales department as a member of the reports workspace
- B . Add the Azure Active Directory group of the sales department as an Admin of the reports workspace.
- C . Distribute an app to the users in the Azure Active Directory group of the sales department.
- D . Share each report to the Azure Active Directory group of the sales department.
You need to create a calculated column to display the month based on the reporting requirements.
Which DAX expression should you use?
- A . FORMAT(‘Date'[date], "MMM YYYY")
- B . FORMAT(‘Date’ [date], "M YY")
- C . FORMAT(‘Date'[date_id], "MMM") & "" & FORMAT(‘Date'[year], "#")
- D . FORMAT(‘Date’ [date_id], "MMM YYYY")
You have a collection of reports for the HR department of your company. The datasets use row-level security (RLS). The company has multiple sales regions that each has an HR manager. You need to ensure that the HR managers can interact with the data from their region only. The HR managers must be prevented from changing the layout of the reports.
How should you provision access to the reports for the HR managers?
- A . Create a new workspace, copy the datasets and reports, and add the HR managers as members of the workspace.
- B . Publish the reports to a different workspace other than the one hosting the datasets.
- C . Publish the reports in an app and grant the HR managers access permission.
- D . Add the HR managers as members of the existing workspace that hosts the reports and the datasets.