
Microsoft DP-900 Practice Exams
Last updated on Oct 22,2026- Exam Code: DP-900
- Exam Name: Microsoft Azure Data Fundamentals
- Certification Provider: Microsoft
- Latest update: Oct 22,2026
Which statement is an example of Data Manipulation Language (DML)?
- A . INSERT
- B . DISABLE
- C . ALTER
- D . DROP
A
Explanation:
Data Manipulation Language (DML) statements:
DELETE
INSERT
UPDATE
Reference: https://docs.microsoft.com/en-us/azure/synapse-analytics/sql-data-warehouse/sql-data-warehouse-reference-tsql-statements
HOTSPOT
To complete the sentence, select the appropriate option in the answer area.
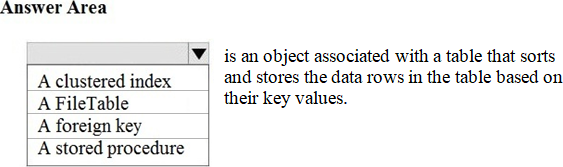
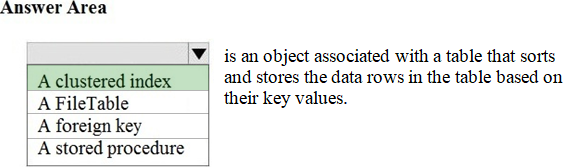
Explanation:
Reference: https://docs.microsoft.com/en-us/sql/relational-databases/indexes/clustered-and-nonclustered-indexes-described?view=sql-server-ver15


You need to create an Azure Storage account.
Data in the account must replica outside the Azure region automatically.
Which two types of replica can you us for the storage account? Each correct answer presents a complete solution. NOTE: Each correct selection is worth one pint.
- A . read-access geo-redundant storage (RA_GRS)
- B . zone-redundant storage (ZRS)
- C . geo-redundant storage (GRS)
- D . locally-redundant storage (LRS)
A, C
Explanation:
Azure Storage offers two options for copying your data to a secondary region:
– Geo-redundant storage (GRS)
– Geo-zone-redundant storage (GZRS)
With GRS or GZRS, the data in the secondary region isn’t available for read or write access unless there is a failover to the secondary region. For read access to the secondary region, configure your storage account to use read-access geo-redundant storage (RA-GRS) or read-access geo-zone-redundant storage (RA-GZRS).
Reference: https://docs.microsoft.com/en-us/azure/storage/common/storage-redundancy#redundancy-in-a-secondary-region
HOTSPOT
Select the answer that correctly completes the sentence.


Explanation:
JSON
JSON (JavaScript Object Notation): This is a text file format that uses a human-readable and compact syntax to represent data as a collection of name-value pairs and arrays. JSON files can express complex and nested data structures by using objects and arrays as values123.
Which clause should you use in a select statement to combine rows in one table with rows in another table?
- A . JOIN
- B . VALUES
- C . set
- D . KEY
A
Explanation:
Reference: https://www.tutorialspoint.com/sql/sql-using-joins.htm
You have a data store that has the structure shown in the following exhibit.
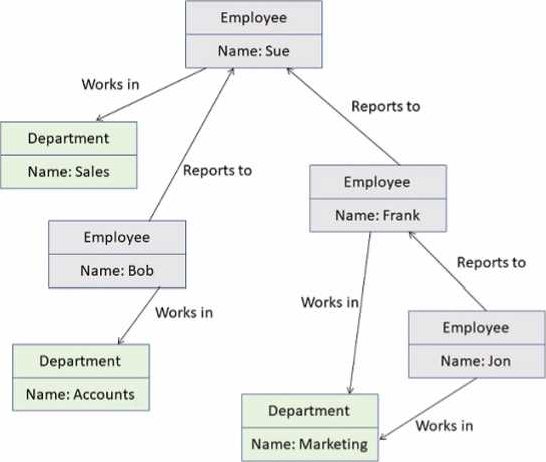
Which type of data store is this?
- A . object data
- B . graph
- C . key/value
- D . time series
DRAG DROP
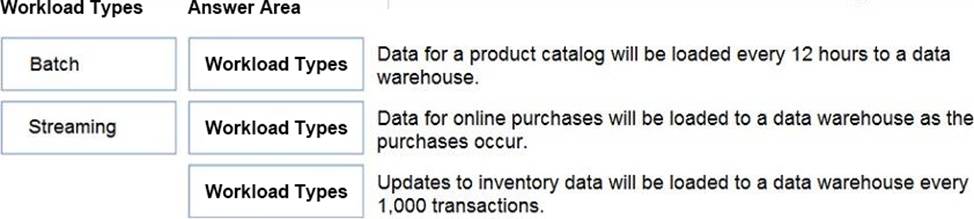
Match the types of workloads to the appropriate scenarios.
To answer, drag the appropriate workload type from the column on the left to its scenario on the right. Each workload type may be used once, more than once, or not at all. NOTE: Each correct match is worth one point.
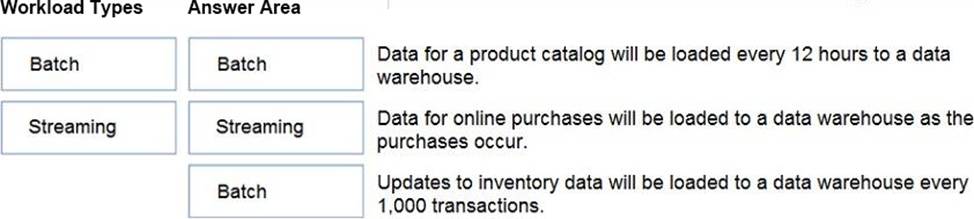
Explanation:
Box 1: Batch
Batch processing refers to the processing of blocks of data that have already been stored over a period of time.
Box 2: Streaming
Stream processing is a big data technology that allows us to process data in real-time as they arrive and detect conditions within a small period of time from the point of receiving the data. It allows us to feed data into analytics tools as soon as they get generated and get instant analytics results.
Box 3: Batch
Reference: https://docs.microsoft.com/en-us/azure/architecture/data-guide/technology-choices/batch-processing
Which type of non-relational data store supports a flexible schema, stores data as JSON files, and stores the all the data for an entity in the same document?
- A . document
- B . columnar
- C . graph
- D . time series the relationship
What are two uses of data visualization? Each correct answer present a complete solution. NOTE: Each correct selection is worth one point.
- A . Represent trends and patterns over time.
- B . Communicate the significance of data.
- C . implement machine learning to predict future values.
- D . Consistently implement business logic across reports
A, B
Explanation:
Data visualization is a key component in being able to gain insight into your data. It helps make big and small data easier for humans to understand. It also makes it easier to detect patterns, trends, and outliers in groups of data.
Data visualization brings data to help you find key business insights quickly and effectively.
Reference: https://docs.microsoft.com/en-us/azure/synapse-analytics/spark/apache-spark-data-visualization