
Microsoft DP-900 Practice Exams
Last updated on Oct 23,2026- Exam Code: DP-900
- Exam Name: Microsoft Azure Data Fundamentals
- Certification Provider: Microsoft
- Latest update: Oct 23,2026


HOTSPOT
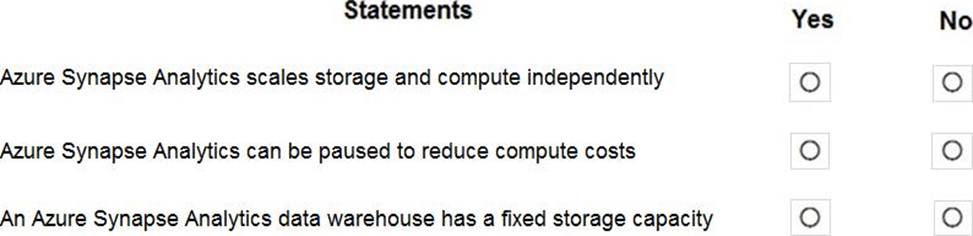
For each of the following statements, select Yes if the statement is true. Otherwise, select No. NOTE: Each correct selection is worth one point.
Explanation:
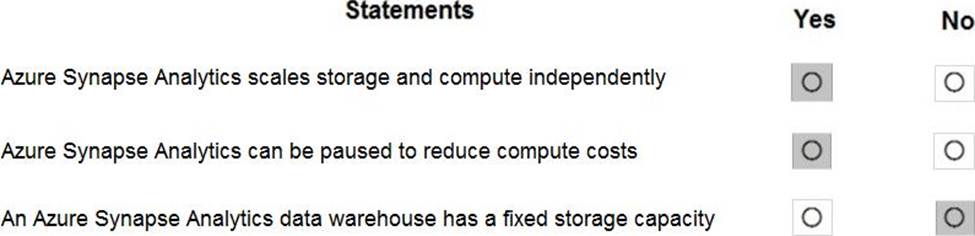
Box 1: Yes
Compute is separate from storage, which enables you to scale compute independently of the data in your system.
Box 2: Yes
You can use the Azure portal to pause and resume the dedicated SQL pool compute resources. Pausing the data warehouse pauses compute. If your data warehouse was paused for the entire hour, you will not be charged compute during that hour.
Box 3: No
Storage is sold in 1 TB allocations. If you grow beyond 1 TB of storage, your storage account will automatically grow to 2 TBs.
Reference: https://azure.microsoft.com/en-us/pricing/details/synapse-analytics/
DRAG DROP
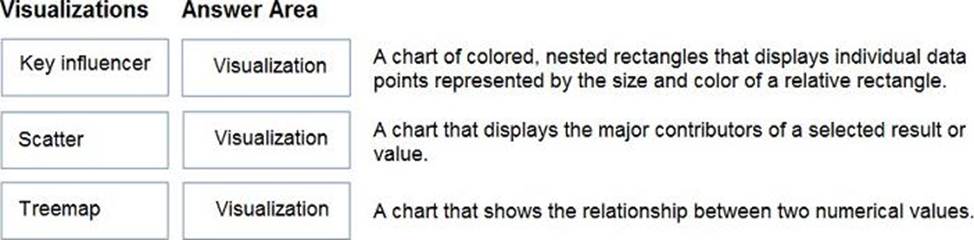
Match the types of visualizations to the appropriate descriptions.
To answer, drag the appropriate visualization type from the column on the left to its description on the right. Each visualization type may be used once, more than once, or not at all. NOTE: Each correct match is worth one point.
Explanation:
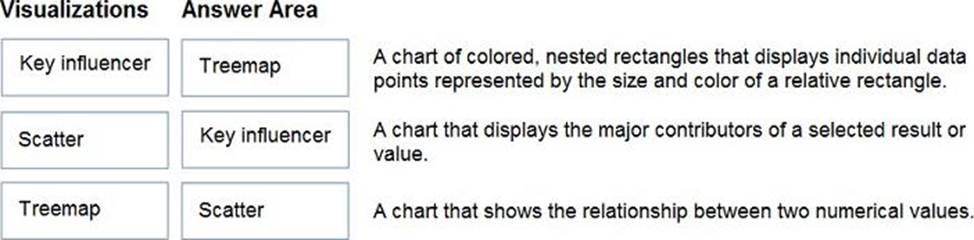
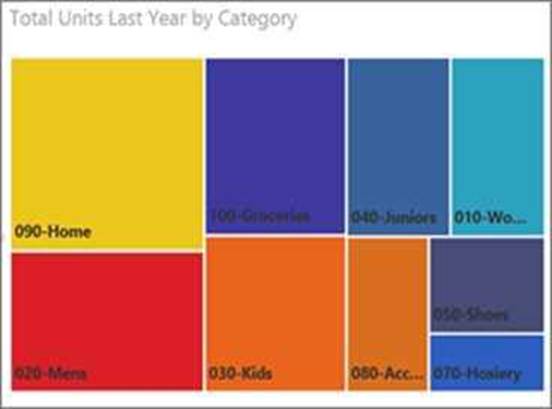
Box 1: Tree map
Treemaps are charts of colored rectangles, with size representing value. They can be hierarchical, with rectangles nested within the main rectangles.
Box 2: Key influencer
A key influencer chart displays the major contributors to a selected result or value.
Box 3: Scatter
Scatter and Bubble charts display relationships between 2 (scatter) or 3 (bubble) quantitative measures — whether or not, in which order, etc.


You are deploying a software as a service (SaaS) application that requires a relational database for Online Transaction Processing (OLTP).
Which Azure service should you use to support the application?
- A . Azure Cosmos DB
- B . Azure Synapse Analytics
- C . Azure HDInsight
- D . Azure SQL Database
D
Explanation:
Azure SQL Database is relational database and a managed service.
Reference: https://cloud.netapp.com/blog/azure-cvo-blg-azure-database-review-your-guide-for-database-assessment
Your company recently reported sales from the third quarter.
You have the chart shown in the following exhibit.
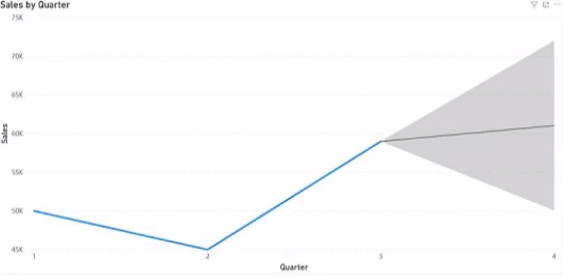
Which type of analysis is shown for the fourth quarter?
- A . predictive
- B . prescription
- C . descriptive
- D . diagnostic
A
Explanation:
Reference:
https://demand-planning.com/2020/01/20/the-differences-between-descriptive-diagnostic-predictive-cognitive-analytics/
https://azure.microsoft.com/en-us/blog/answering-whats-happening-whys-happening-and-what-will-happen-with-iot-analytics/
HOTSPOT
To complete the sentence, select the appropriate option in the answer area.


Your company needs to design a database that illustrates the relationships between utilization levels of individual network devices across a local area network.
Which type of data store should you use?
- A . graph
- B . key/value
- C . document
- D . columnar
A
Explanation:
Data as it appears in the real world is naturally connected. Traditional data modeling focuses on defining entities separately and computing their relationships at runtime. While this model has its advantages, highly connected data can be challenging to manage under its constraints.
A graph database approach relies on persisting relationships in the storage layer instead, which leads to highly efficient graph retrieval operations. Azure Cosmos DB’s Gremlin API supports the property graph model.
Reference: https://docs.microsoft.com/en-us/azure/cosmos-db/graph-introduction#introduction-to-graph-databases


You need to create a visualization of running sales totals per quarter as shown in the following exhibit.
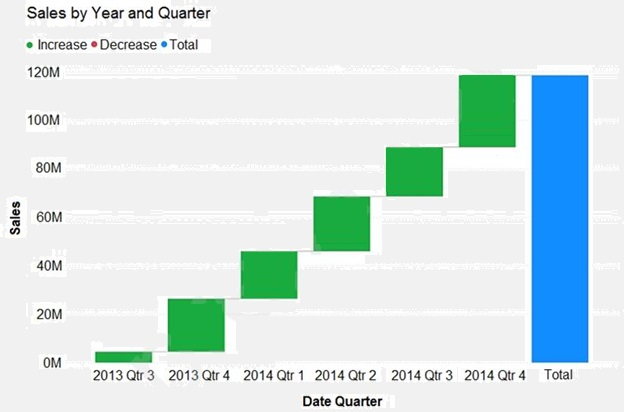
What should you create in Power BI Desktop?
- A . a waterfall chart
- B . a ribbon chart
- C . a bar chart
- D . a decomposition tree
A
Explanation:
Reference: https://docs.microsoft.com/en-us/power-bi/visuals/power-bi-visualization-types-for-reports-and-q-and-a