
Databricks Databricks Certified Data Analyst Associate Practice Exams
Last updated on Oct 21,2026- Exam Code: Databricks Certified Data Analyst Associate
- Exam Name: Databricks Certified Data Analyst Associate Exam
- Certification Provider: Databricks
- Latest update: Oct 21,2026
A data analyst has recently joined a new team that uses Databricks SQL, but the analyst has never used Databricks before. The analyst wants to know where in Databricks SQL they can write and execute SQL queries.
On which of the following pages can the analyst write and execute SQL queries?
- A . Data page
- B . Dashboards page
- C . Queries page
- D . Alerts page
- E . SQL Editor page
E
Explanation:
The SQL Editor page is where the analyst can write and execute SQL queries in Databricks SQL. The SQL Editor page has a query pane where the analyst can type or paste SQL statements, and a results pane where the analyst can view the query results in a table or a chart. The analyst can also browse data objects, edit multiple queries, execute a single query or multiple queries, terminate a query, save a query, download a query result, and more from the SQL Editor page.
Reference: Create a query in SQL editor
A data team has been given a series of projects by a consultant that need to be implemented in the Databricks Lakehouse Platform.
Which of the following projects should be completed in Databricks SQL?
- A . Testing the quality of data as it is imported from a source
- B . Tracking usage of feature variables for machine learning projects
- C . Combining two data sources into a single, comprehensive dataset
- D . Segmenting customers into like groups using a clustering algorithm
- E . Automating complex notebook-based workflows with multiple tasks
C
Databricks SQL is a service that allows users to query data in the lakehouse using SQL and create visualizations and dashboards1. One of the common use cases for Databricks SQL is to combine data from different sources and formats into a single, comprehensive dataset that can be used for further analysis or reporting2. For example, a data analyst can use Databricks SQL to join data from a CSV file and a Parquet file, or from a Delta table and a JDBC table, and create a new table or view that contains the combined data3. This can help simplify the data management and governance, as well as improve the data quality and consistency.
Reference: Databricks SQL overview
Databricks SQL use cases
Joining data sources
What is a benefit of using Databricks SQL for business intelligence (Bl) analytics projects instead of using third-party Bl tools?
- A . Computations, data, and analytical tools on the same platform
- B . Advanced dashboarding capabilities
- C . Simultaneous multi-user support
- D . Automated alerting systems
A
Explanation:
Databricks SQL offers a unified platform where computations, data storage, and analytical tools coexist seamlessly. This integration allows business intelligence (BI) analytics projects to be executed more efficiently, as users can perform data processing and analysis without the need to transfer data between disparate systems. By consolidating these components, Databricks SQL streamlines workflows, reduces latency, and enhances data governance. While third-party BI tools may offer advanced dashboarding capabilities, simultaneous multi-user support, and automated alerting systems, they often require integration with separate data processing platforms, which can introduce complexity and potential inefficiencies.
Reference: Databricks AI & BI: Transform Data into Actionable Insights
An analyst writes a query that contains a query parameter. They then add an area chart visualization to the query. While adding the area chart visualization to a dashboard, the analyst chooses "Dashboard Parameter" for the query parameter associated with the area chart.
Which of the following statements is true?
- A . The area chart will use whatever is selected in the Dashboard Parameter while all or the other visualizations will remain changed regardless of their parameter use.
- B . The area chart will use whatever is selected in the Dashboard Parameter along with all of the other visualizations in the dashboard that use the same parameter.
- C . The area chart will use whatever value is chosen on the dashboard at the time the area chart is added to the dashboard.
- D . The area chart will use whatever value is input by the analyst when the visualization is added to the dashboard. The parameter cannot be changed by the user afterwards.
- E . The area chart will convert to a Dashboard Parameter.
B
A Dashboard Parameter is a parameter that is configured for one or more visualizations within a dashboard and appears at the top of the dashboard. The parameter values specified for a Dashboard Parameter apply to all visualizations reusing that particular Dashboard Parameter1. Therefore, if the analyst chooses “Dashboard Parameter” for the query parameter associated with the area chart, the area chart will use whatever is selected in the Dashboard Parameter along with all of the other visualizations in the dashboard that use the same parameter. This allows the user to filter the data across multiple visualizations using a single parameter widget2.
Reference: Databricks SQL dashboards, Query parameters
A data engineering team has created a Structured Streaming pipeline that processes data in micro-batches and populates gold-level tables. The microbatches are triggered every minute. A data analyst has created a dashboard based on this gold-level data. The project stakeholders want to see the results in the dashboard updated within one minute or less of new data becoming available within the gold-level tables.
Which of the following cautions should the data analyst share prior to setting up the dashboard to complete this task?
- A . The required compute resources could be costly
- B . The gold-level tables are not appropriately clean for business reporting
- C . The streaming data is not an appropriate data source for a dashboard
- D . The streaming cluster is not fault tolerant
- E . The dashboard cannot be refreshed that quickly
A
Explanation:
A Structured Streaming pipeline that processes data in micro-batches and populates gold-level tables every minute requires a high level of compute resources to handle the frequent data ingestion, processing, and writing. This could result in a significant cost for the organization, especially if the data volume and velocity are large. Therefore, the data analyst should share this caution with the project stakeholders before setting up the dashboard and evaluate the trade-offs between the desired refresh rate and the available budget. The other options are not valid cautions because:
B. The gold-level tables are assumed to be appropriately clean for business reporting, as they are the final output of the data engineering pipeline. If the data quality is not satisfactory, the issue should be addressed at the source or silver level, not at the gold level.
C. The streaming data is an appropriate data source for a dashboard, as it can provide near real-time insights and analytics for the business users. Structured Streaming supports various sources and sinks for streaming data, including Delta Lake, which can enable both batch and streaming queries on the same data.
D. The streaming cluster is fault tolerant, as Structured Streaming provides end-to-end exactly-once fault-tolerance guarantees through checkpointing and write-ahead logs. If a query fails, it can be restarted from the last checkpoint and resume processing.
E. The dashboard can be refreshed within one minute or less of new data becoming available in the gold-level tables, as Structured Streaming can trigger micro-batches as fast as possible (every few seconds) and update the results incrementally. However, this may not be necessary or optimal for the business use case, as it could cause frequent changes in the dashboard and consume more resources.
Reference: Streaming on Databricks, Monitoring Structured Streaming queries on Databricks, A look at the new Structured Streaming UI in Apache Spark 3.0, Run your first Structured Streaming workload
What describes the variance of a set of values?
- A . Variance is a measure of how far a single observed value is from a set ot va IN
- B . Variance is a measure of how far an observed value is from the variable’s maximum or minimum value.
- C . Variance is a measure of central tendency of a set of values.
- D . Variance is a measure of how far a set of values is spread out from the sets central value.
D
Explanation:
Variance is a statistical measure that quantifies the dispersion or spread of a set of values around their mean (central value). It is calculated by taking the average of the squared differences between each value and the mean of the dataset. A higher variance indicates that the data points are more spread out from the mean, while a lower variance suggests that they are closer to the mean. This measure is fundamental in statistics to understand the degree of variability within a dataset.WikipediaWikipedia+1Investopedia+1
Reference: Variance – Wikipedia
Where in the Databricks SQL workspace can a data analyst configure a refresh schedule for a query when the query is not attached to a dashboard or alert?
- A . Data bxplorer
- B . The Visualization editor
- C . The Query Editor
- D . The Dashboard Editor
C
Explanation:
In Databricks SQL, to configure a refresh schedule for a query that is not attached to a dashboard or alert, a data analyst should use the Query Editor. Within the Query Editor, there is an option to set up scheduled executions for queries. This feature enables the query to run at specified intervals, ensuring that the results are updated regularly. By scheduling queries in this manner, analysts can automate data refreshes and maintain up-to-date query results without manual intervention.
Reference: Schedule a query – Databricks Documentation
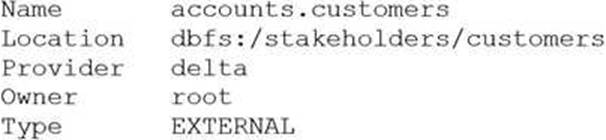
After running DESCRIBE EXTENDED accounts.customers;, the following was returned:
Now, a data analyst runs the following command:
DROP accounts.customers;
Which of the following describes the result of running this command?
- A . Running SELECT * FROM delta. `dbfs:/stakeholders/customers` results in an error.
- B . Running SELECT * FROM accounts.customers will return all rows in the table.
- C . All files with the .customers extension are deleted.
- D . The accounts.customers table is removed from the metastore, and the underlying data files are deleted.
- E . The accounts.customers table is removed from the metastore, but the underlying data files are untouched.
E
Explanation:
the accounts.customers table is an EXTERNAL table, which means that it is stored outside the default warehouse directory and is not managed by Databricks. Therefore, when you run the DROP command on this table, it only removes the metadata information from the metastore, but does not delete the actual data files from the file system. This means that you can still access the data using the location path (dbfs:/stakeholders/customers) or create another table pointing to the same location. However, if you try to query the table using its name (accounts.customers), you will get an error because the table no longer exists in the metastore.
Reference: DROP TABLE | Databricks on AWS, Best practices for dropping a managed Delta Lake table – Databricks
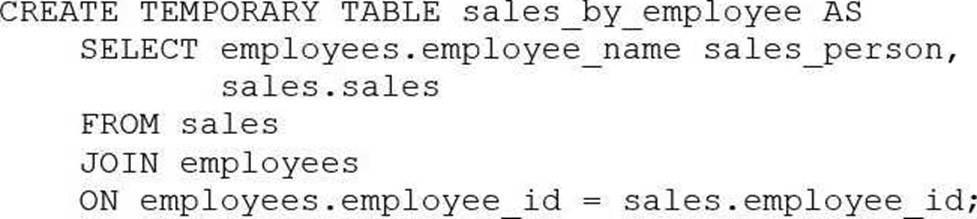
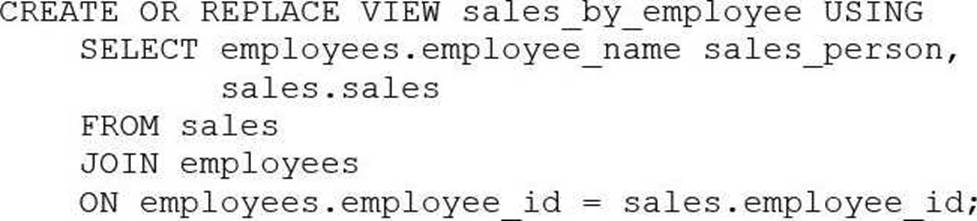
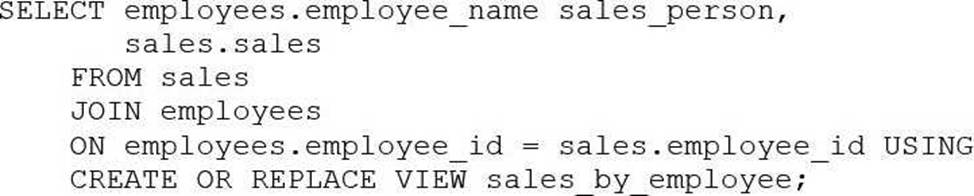
A business analyst has been asked to create a data entity/object called sales_by_employee. It should always stay up-to-date when new data are added to the sales table. The new entity should have the columns sales_person, which will be the name of the employee from the employees table, and sales, which will be all sales for that particular sales person. Both the sales table and the employees table have an employee_id column that is used to identify the sales person.
Which of the following code blocks will accomplish this task?
A)
B)
C)
D)

- A . Option
- B . Option
- C . Option
- D . Option
D
Explanation:
The SQL code provided in Option D is the correct way to create a view named sales_by_employee that will always stay up-to-date with the sales and employees tables. The code uses the CREATE OR REPLACE VIEW statement to define a new view that joins the sales and employees tables on the employee_id column. It selects the employee_name as sales_person and all sales for each employee, ensuring that the data entity/object is always up-to-date when new data are added to these tables.
Reference: The answer can be verified from Databricks SQL documentation which provides insights on creating views using SQL queries, joining tables, and selecting specific columns to be included in the view. Reference link: Databricks SQL
What describes Partner Connect in Databricks?
- A . it allows for free use of Databricks partner tools through a common API.
- B . it allows multi-directional connection between Databricks and Databricks partners easier.
- C . It exposes connection information to third-party tools via Databricks partners.
- D . It is a feature that runs Databricks partner tools on a Databricks SQL Warehouse (formerly known as a SQL endpoint).
B
Explanation:
Databricks Partner Connect is designed to simplify and streamline the integration between Databricks and its technology partners. It provides a unified interface within the Databricks platform that facilitates the discovery and connection to a variety of data, analytics, and AI tools. By automating the configuration of necessary resources such as clusters, tokens, and connection files, Partner Connect enables seamless, bi-directional data flow between Databricks and partner solutions. This integration enhances the overall functionality of the Databricks Lakehouse by allowing users to easily incorporate external tools and services into their workflows, thereby expanding the platform’s capabilities and fostering a more cohesive data ecosystem. https://www.databricks.com/blog/2021/11/18/now-generally-available-introducing-databricks-partner-connect-to-discover-and-connect-popular-data-and-ai-tools-to-the-lakehouse?utm_source=chatgpt.com
Reference: Discover Databricks Partner Connect