
Databricks Databricks Certified Data Analyst Associate Practice Exams
Last updated on Oct 21,2026- Exam Code: Databricks Certified Data Analyst Associate
- Exam Name: Databricks Certified Data Analyst Associate Exam
- Certification Provider: Databricks
- Latest update: Oct 21,2026
A data analyst has been asked to produce a visualization that shows the flow of users through a website.
Which of the following is used for visualizing this type of flow?
- A . Heatmap
- B . IChoropleth
- C . Word Cloud
- D . Pivot Table
- E . Sankey
E
A Sankey diagram is a type of visualization that shows the flow of data between different nodes or categories. It is often used to represent the movement of users through a website, as it can show the paths they take, the sources they come from, the pages they visit, and the outcomes they achieve. A Sankey diagram consists of links and nodes, where the links represent the volume or weight of the flow, and the nodes represent the stages or steps of the flow. The width of the links is proportional to the amount of flow, and the color of the links can indicate different attributes or segments of the flow. A Sankey diagram can help identify the most common or popular user journeys, the bottlenecks or drop-offs in the flow, and the opportunities for improvement or optimization.
Reference: The answer can be verified from Databricks documentation which provides examples and instructions on how to create Sankey diagrams using Databricks SQL Analytics and Databricks Visualizations. Reference links: Databricks SQL Analytics – Sankey Diagram, Databricks Visualizations – Sankey Diagram
What describes the variance of a set of values?
- A . Variance is a measure of how far a single observed value is from a set ot va IN
- B . Variance is a measure of how far an observed value is from the variable’s maximum or minimum value.
- C . Variance is a measure of central tendency of a set of values.
- D . Variance is a measure of how far a set of values is spread out from the sets central value.
D
Explanation:
Variance is a statistical measure that quantifies the dispersion or spread of a set of values around their mean (central value). It is calculated by taking the average of the squared differences between each value and the mean of the dataset. A higher variance indicates that the data points are more spread out from the mean, while a lower variance suggests that they are closer to the mean. This measure is fundamental in statistics to understand the degree of variability within a dataset.WikipediaWikipedia+1Investopedia+1
Reference: Variance – Wikipedia
A data engineer is working with a nested array column products in table transactions. They want to expand the table so each unique item in products for each row has its own row where the transaction_id column is duplicated as necessary.
They are using the following incomplete command:
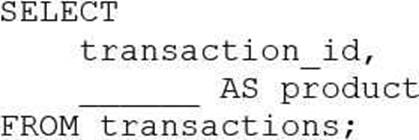
Which of the following lines of code can they use to fill in the blank in the above code block so that it successfully completes the task?
- A . array distinct(produces)
- B . explode(produces)
- C . reduce(produces)
- D . array(produces)
- E . flatten(produces)
B
The explode function is used to transform a DataFrame column of arrays or maps into multiple rows, duplicating the other column’s values. In this context, it will be used to expand the nested array column products in the transactions table so that each unique item in products for each row has its own row and the transaction_id column is duplicated as necessary.
Reference: Databricks Documentation
I also noticed that you sent me an image along with your message. The image shows a snippet of SQL code that is incomplete. It begins with “SELECT” indicating a query to retrieve data. “transaction_id,” suggests that transaction_id is one of the columns being selected. There are blanks indicated by underscores where certain parts of the SQL command should be, including what appears to be an alias for a column and part of the FROM clause. The query ends with “FROM transactions;” indicating data is being selected from a ‘transactions’ table.
If you are interested in learning more about Databricks Data Analyst Associate certification, you can check out the following resources:
Databricks Certified Data Analyst Associate: This is the official page for the certification exam, where
you can find the exam guide, registration details, and preparation tips.
Data Analysis With Databricks SQL: This is a self-paced course that covers the topics and skills required for the certification exam. You can access it for free on Databricks Academy.
Tips for the Databricks Certified Data Analyst Associate Certification: This is a blog post that provides some useful advice and study tips for passing the certification exam.
Databricks Certified Data Analyst Associate Certification: This is another blog post that gives an overview of the certification exam and its benefits.
Which of the following statements about a refresh schedule is incorrect?
- A . A query can be refreshed anywhere from 1 minute lo 2 weeks
- B . Refresh schedules can be configured in the Query Editor.
- C . A query being refreshed on a schedule does not use a SQL Warehouse (formerly known as SQL Endpoint).
- D . A refresh schedule is not the same as an alert.
- E . You must have workspace administrator privileges to configure a refresh schedule
E
Explanation:
This statement is incorrect. In Databricks SQL, any user with sufficient permissions on the query or dashboard can configure a refresh schedule―workspace administrator privileges are not required.
Here is the breakdown of the correct information:
Which of the following statements describes descriptive statistics?
- A . A branch of statistics that uses summary statistics to quantitatively describe and summarize data.
- B . A branch of statistics that uses a variety of data analysis techniques to infer properties of an underlying distribution of probability.
- C . A branch of statistics that uses quantitative variables that must take on a finite or countably infinite set of values.
- D . A branch of statistics that uses summary statistics to categorically describe and summarize data.
- E . A branch of statistics that uses quantitative variables that must take on an uncountable set of values.
A
Explanation:
Descriptive statistics is a branch of statistics that uses summary statistics, such as mean, median, mode, standard deviation, range, frequency, or correlation, to quantitatively describe and summarize data. Descriptive statistics can help data analysts understand the main features of a data set, such as its central tendency, variability, or distribution. Descriptive statistics can also help data analysts visualize data using charts, graphs, or tables. Descriptive statistics do not make any inferences or predictions about the data, unlike inferential statistics, which use data analysis techniques to infer properties of an underlying population or probability distribution from a sample of
data.
Reference: Databricks – Descriptive Statistics, Databricks – Data Analysis with Databricks SQL
A data engineering team has created a Structured Streaming pipeline that processes data in micro-batches and populates gold-level tables. The microbatches are triggered every minute. A data analyst has created a dashboard based on this gold-level data. The project stakeholders want to see the results in the dashboard updated within one minute or less of new data becoming available within the gold-level tables.
Which of the following cautions should the data analyst share prior to setting up the dashboard to complete this task?
- A . The required compute resources could be costly
- B . The gold-level tables are not appropriately clean for business reporting
- C . The streaming data is not an appropriate data source for a dashboard
- D . The streaming cluster is not fault tolerant
- E . The dashboard cannot be refreshed that quickly
A
Explanation:
A Structured Streaming pipeline that processes data in micro-batches and populates gold-level tables every minute requires a high level of compute resources to handle the frequent data ingestion, processing, and writing. This could result in a significant cost for the organization, especially if the data volume and velocity are large. Therefore, the data analyst should share this caution with the project stakeholders before setting up the dashboard and evaluate the trade-offs between the desired refresh rate and the available budget. The other options are not valid cautions because:
B. The gold-level tables are assumed to be appropriately clean for business reporting, as they are the final output of the data engineering pipeline. If the data quality is not satisfactory, the issue should be addressed at the source or silver level, not at the gold level.
C. The streaming data is an appropriate data source for a dashboard, as it can provide near real-time insights and analytics for the business users. Structured Streaming supports various sources and sinks for streaming data, including Delta Lake, which can enable both batch and streaming queries on the same data.
D. The streaming cluster is fault tolerant, as Structured Streaming provides end-to-end exactly-once fault-tolerance guarantees through checkpointing and write-ahead logs. If a query fails, it can be restarted from the last checkpoint and resume processing.
E. The dashboard can be refreshed within one minute or less of new data becoming available in the gold-level tables, as Structured Streaming can trigger micro-batches as fast as possible (every few seconds) and update the results incrementally. However, this may not be necessary or optimal for the business use case, as it could cause frequent changes in the dashboard and consume more resources.
Reference: Streaming on Databricks, Monitoring Structured Streaming queries on Databricks, A look at the new Structured Streaming UI in Apache Spark 3.0, Run your first Structured Streaming workload
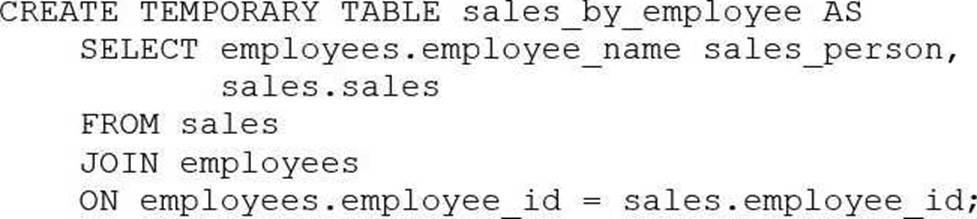
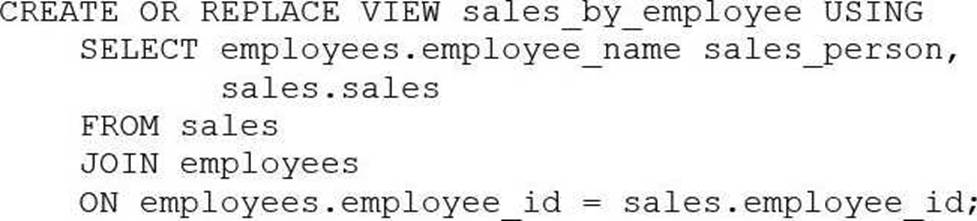
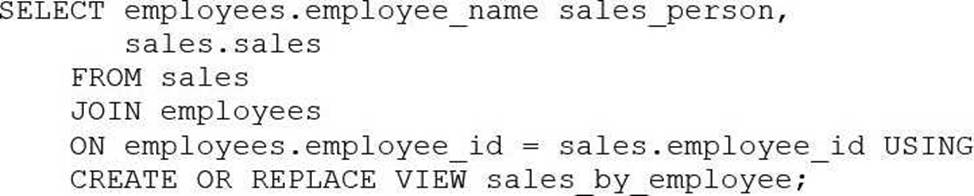
A business analyst has been asked to create a data entity/object called sales_by_employee. It should always stay up-to-date when new data are added to the sales table. The new entity should have the columns sales_person, which will be the name of the employee from the employees table, and sales, which will be all sales for that particular sales person. Both the sales table and the employees table have an employee_id column that is used to identify the sales person.
Which of the following code blocks will accomplish this task?
A)
B)
C)
D)

- A . Option
- B . Option
- C . Option
- D . Option
D
Explanation:
The SQL code provided in Option D is the correct way to create a view named sales_by_employee that will always stay up-to-date with the sales and employees tables. The code uses the CREATE OR REPLACE VIEW statement to define a new view that joins the sales and employees tables on the employee_id column. It selects the employee_name as sales_person and all sales for each employee, ensuring that the data entity/object is always up-to-date when new data are added to these tables.
Reference: The answer can be verified from Databricks SQL documentation which provides insights on creating views using SQL queries, joining tables, and selecting specific columns to be included in the view. Reference link: Databricks SQL
A data analyst needs to use the Databricks Lakehouse Platform to quickly create SQL queries and data visualizations. It is a requirement that the compute resources in the platform can be made serverless, and it is expected that data visualizations can be placed within a dashboard.
Which of the following Databricks Lakehouse Platform services/capabilities meets all of these requirements?
- A . Delta Lake
- B . Databricks Notebooks
- C . Tableau
- D . Databricks Machine Learning
- E . Databricks SQL
E
Explanation:
Databricks SQL is a serverless data warehouse on the Lakehouse that lets you run all of your SQL and BI applications at scale with your tools of choice, all at a fraction of the cost of traditional cloud data warehouses1. Databricks SQL allows you to create SQL queries and data visualizations using the SQL Analytics UI or the Databricks SQL CLI2. You can also place your data visualizations within a dashboard and share it with other users in your organization3. Databricks SQL is powered by Delta Lake, which provides reliability, performance, and governance for your data lake4.
Reference: Databricks SQL
Query data using SQL Analytics
Visualizations in Databricks notebooks
Delta Lake
Consider the following two statements:
Statement 1:

Statement 2:

Which of the following describes how the result sets will differ for each statement when they are run in Databricks SQL?
- A . The first statement will return all data from the customers table and matching data from the orders table. The second statement will return all data from the orders table and matching data from the customers table. Any missing data will be filled in with NULL.
- B . When the first statement is run, only rows from the customers table that have at least one match with the orders table on customer_id will be returned. When the second statement is run, only those rows in the customers table that do not have at least one match with the orders table on customer_id will be returned.
- C . There is no difference between the result sets for both statements.
- D . Both statements will fail because Databricks SQL does not support those join types.
- E . When the first statement is run, all rows from the customers table will be returned and only the customer_id from the orders table will be returned. When the second statement is run, only those rows in the customers table that do not have at least one match with the orders table on customer_id will be returned.
B
Explanation:
Based on the images you sent, the two statements are SQL queries for different types of joins between the customers and orders tables. A join is a way of combining the rows from two table references based on some criteria. The join type determines how the rows are matched and what kind of result set is returned. The first statement is a query for a LEFT SEMI JOIN, which returns only the rows from the left table reference (customers) that have a match with the right table reference (orders) on the join condition (customer_id). The second statement is a query for a LEFT ANTI JOIN, which returns only the rows from the left table reference (customers) that have no match with the right table reference (orders) on the join condition (customer_id). Therefore, the result sets for the two statements will differ in the following way:
The first statement will return a subset of the customers table that contains only the customers who
have placed at least one order. The number of rows returned will be less than or equal to the number of rows in the customers table, depending on how many customers have orders. The number of columns returned will be the same as the number of columns in the customers table, as the LEFT SEMI JOIN does not include any columns from the orders table.
The second statement will return a subset of the customers table that contains only the customers who have not placed any order. The number of rows returned will be less than or equal to the number of rows in the customers table, depending on how many customers have no orders. The number of columns returned will be the same as the number of columns in the customers table, as the LEFT ANTI JOIN does not include any columns from the orders table. The other options are not correct because:
A data analyst needs to share a Databricks SQL dashboard with stakeholders that are not permitted to have accounts in the Databricks deployment. The stakeholders need to be notified every time the dashboard is refreshed.
Which approach can the data analyst use to accomplish this task with minimal effort/
- A . By granting the stakeholders’ email addresses permissions to the dashboard
- B . By adding the stakeholders’ email addresses to the refresh schedule subscribers list
- C . By granting the stakeholders’ email addresses to the SQL Warehouse (formerly known as endpoint) subscribers list
- D . By downloading the dashboard as a PDF and emailing it to the stakeholders each time it is refreshed
B
Explanation:
To share a Databricks SQL dashboard with stakeholders who do not have accounts in the Databricks deployment and ensure they are notified upon each refresh, the data analyst can add the stakeholders’ email addresses to the dashboard’s refresh schedule subscribers list. This approach allows the stakeholders to receive email notifications containing the latest dashboard updates
without requiring them to have direct access to the Databricks workspace. This method is efficient and minimizes effort, as it automates the notification process and ensures stakeholders remain informed of the most recent data insights.
Reference: Manage scheduled dashboard updates and subscriptions