
CompTIA DA0-001 Practice Exams
Last updated on Nov 16,2026- Exam Code: DA0-001
- Exam Name: CompTIA Data+ Certification
- Certification Provider: CompTIA
- Latest update: Nov 16,2026
An analyst conducted a preliminary analysis for a data set and identified several patterns and anomalies.
Which of the following analysis techniques did the analyst use?
- A . Performance analysis
- B . Exploratory analysis
- C . Link analysis
- D . Trend analysis
An analyst conducted a preliminary analysis for a data set and identified several patterns and anomalies.
Which of the following analysis techniques did the analyst use?
- A . Performance analysis
- B . Exploratory analysis
- C . Link analysis
- D . Trend analysis
Standardized tests are given to students in the middle of each month, and the results are ready by the end of the month. The superintendent needs a quick view of test performance.
Which of the following would be the best recommendation to meet the superintendent’s requirements?
- A . A dashboard with a continuous data stream and saved searches
- B . A report of test scores by classroom, emailed to the superintendent at the end of the month
- C . A report of test scores with pie charts showing student performance
- D . A dashboard with a scheduled delivery, the ability to filter scores by school, and bar charts for comparison
Given the diagram below:
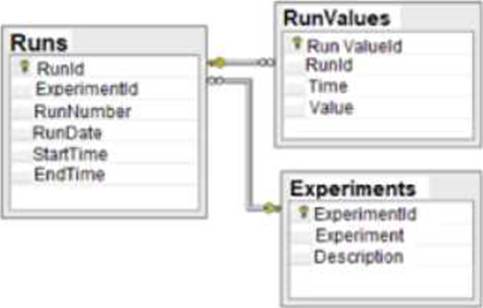
Which of the following data schemas shown?
- A . Key-value pairs
- B . Online transactional processing
- C . Data Lake
- D . Relational database
A data analyst is asked on the morning of April 9, 2020, to create a sales report that identifies sales year to date. The daily sales data is current through the end of the day.
Which of the following date ranges should be on the report?
- A . January 1, 2020 to April 1, 2020
- B . January 1, 2020 to April 7, 2020
- C . January 1, 2020 to April 8, 2020
- D . January 1, 2020 to April 9, 2020
An analyst notices changes in sales ratios when analyzing a quarterly report.
Which of the following is the analyst conducting?
- A . A gap analysis
- B . A link analysis
- C . A trend analysis
- D . A statistical analysis
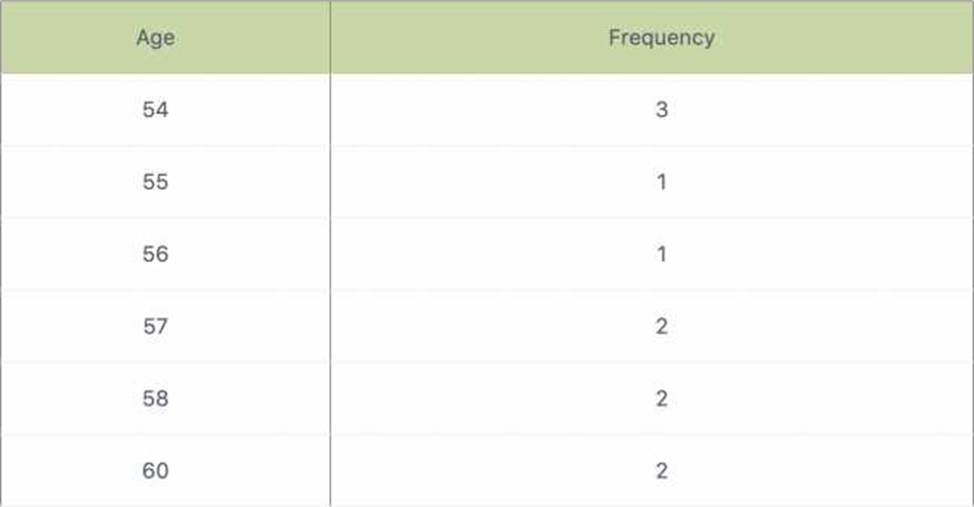
Consider this dataset showing the retirement age of 11 people, in whole years:
54, 54, 54, 55, 56, 57, 57, 58, 58, 60, 60
This tables show a simple frequency distribution of the retirement age data.
- A . 56
- B . 55
- C . 57
- D . 54
Given the following report:
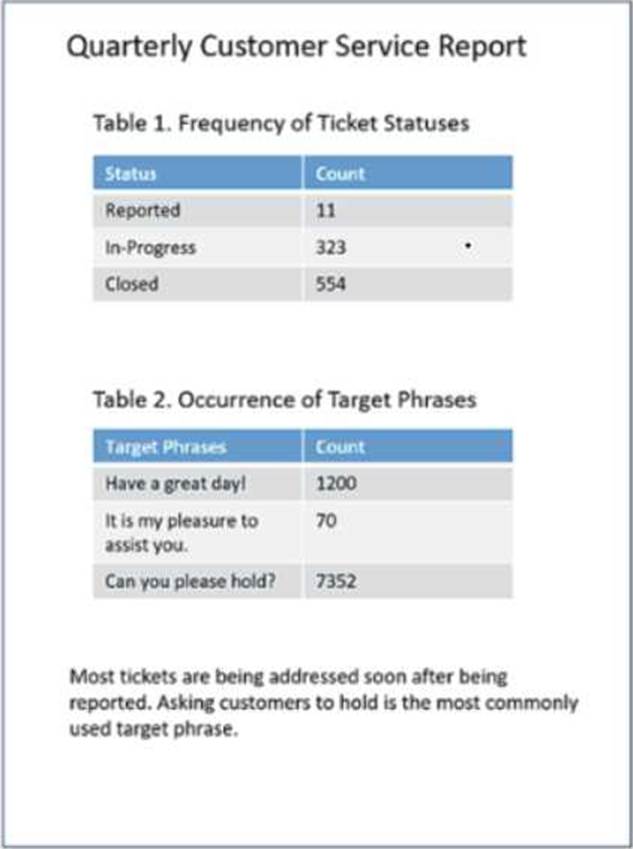
Which of the following components need to be added to ensure the report is point-in-time and static? (Choose two.)
- A . A control group for the phrases
- B . A summary of the KPIs
- C . Filter buttons for the status
- D . The date when the report was last accessed
- E . The time period the report covers
- F . The date on which the report was run
Which of the following is an example of a flat file?
- A . CSV file
- B . PDF file
- C . JSON file
- D . JPEG file
A customer survey reveals 90% positive feedback.
Which of the following statistical methods would be best to utilize to determine the reliability of a data set and predict how a larger sample of customers over the same time period might respond?
- A . Calculate a high variance on survey responses.
- B . Calculate the maximum range of the survey responses.
- C . Calculate a low standard deviation on survey responses.
- D . Remove any data more than 4 standard deviation from the mean.